Fig. 14
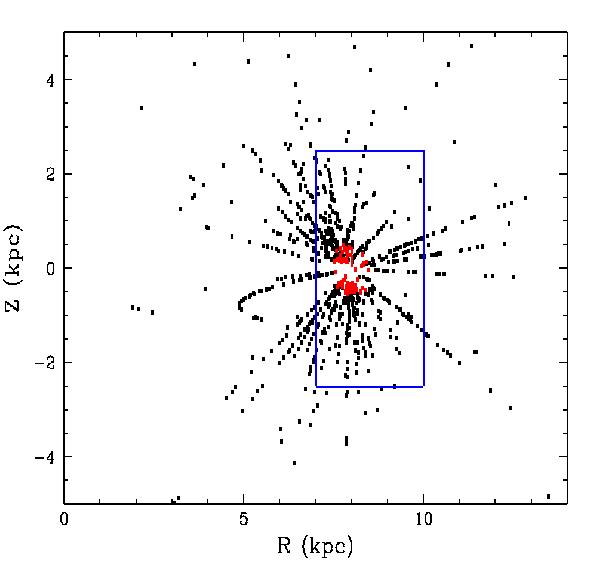
Target’s location, for sub-sample e of Fig. 12, in vertical distance to the Galactic plane (Z) and radial cylindrical Galactic coordinate (R). Red points indicate the stars with a distance value lower than 600 pc from the Sun (10% of the sample). The blue rectangle shows the maximum R and Z values of the Lee et al. (2011b) analysis of SEGUE data.
Current usage metrics show cumulative count of Article Views (full-text article views including HTML views, PDF and ePub downloads, according to the available data) and Abstracts Views on Vision4Press platform.
Data correspond to usage on the plateform after 2015. The current usage metrics is available 48-96 hours after online publication and is updated daily on week days.
Initial download of the metrics may take a while.