Fig. 12
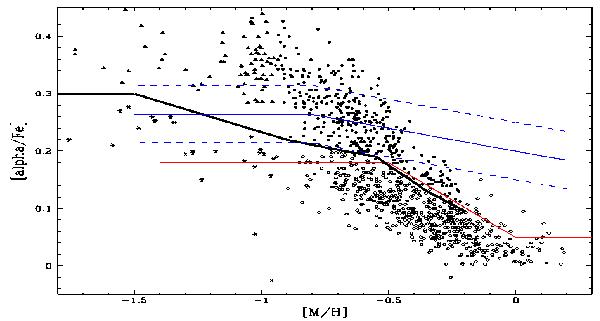
α-elements over iron abundance as a function of metallicity for sub-sample e. Filled dots are thick disc sequence stars, open circles are thin disc sequence objects. Metal-poor stars ([M/H] < −1.0) are marked with filled triangles and asterisks, depending on whether their [α/Fe] are in the high-α or the low-α regime. The black line shows the proposed division between the thin and thick disc sequences in agreement with Fig. 11. The red line shows the separation proposed by high-resolution analysis of Adibekyan et al. (2012) for the solar neighbourhood. The blue solid line is the separation proposed by Lee et al. (2011b) from low-resolution SEGUE data and the two dashed lines indicate their dividing points for the thin and the thick disc stars to avoid misclassifying stars.
Current usage metrics show cumulative count of Article Views (full-text article views including HTML views, PDF and ePub downloads, according to the available data) and Abstracts Views on Vision4Press platform.
Data correspond to usage on the plateform after 2015. The current usage metrics is available 48-96 hours after online publication and is updated daily on week days.
Initial download of the metrics may take a while.