Fig. 4
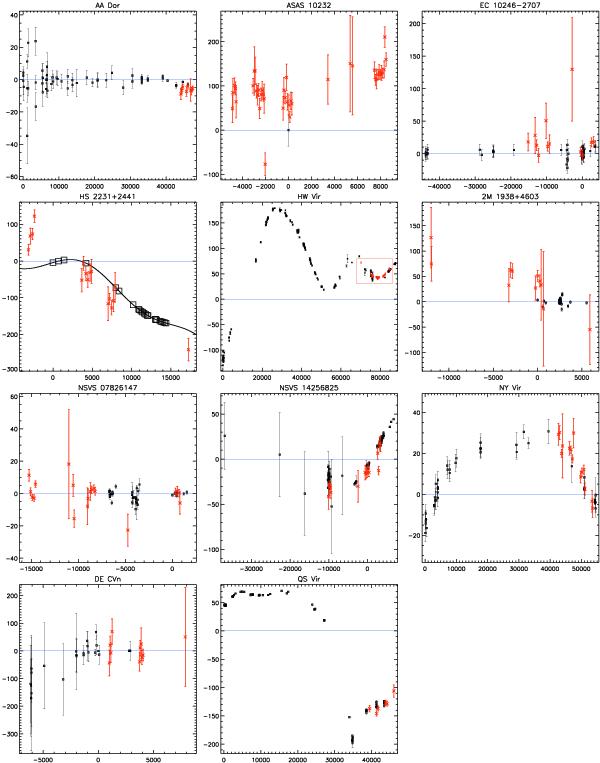
O−C diagrams for eleven PCEBs according to ephemerides given in text, including previously published eclipse timings (black squares) and new binned SuperWASP timings (red crosses). The x axes indicate cycle count; the y axes O−C values in seconds. For HW Vir, the region containing new SuperWASP values is surrounded by a red rectangle for clarity. For HS 2231+2441, larger black squares indicate the approximate locations of the unpublished observations of Qian et al. (2010b), with their fitted curve overplotted as a solid line.
Current usage metrics show cumulative count of Article Views (full-text article views including HTML views, PDF and ePub downloads, according to the available data) and Abstracts Views on Vision4Press platform.
Data correspond to usage on the plateform after 2015. The current usage metrics is available 48-96 hours after online publication and is updated daily on week days.
Initial download of the metrics may take a while.