Fig. 3
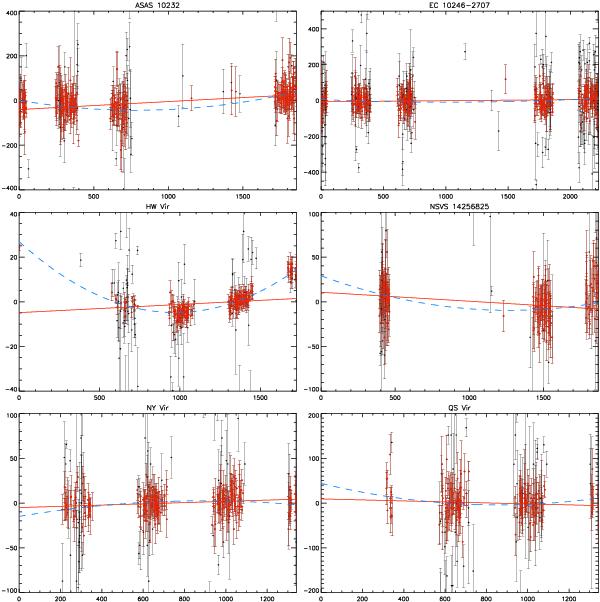
O−C diagrams for six PCEBs potentially indicating period change, constructed using SuperWASP data only. The x axes indicate night count since the start of observation (since whole nights are fitted with template curves); the y axes give O−C measurements in seconds. Automatically-excluded outliers are in black and selected good minimum timings in red (colour online only); a small number of more extreme outliers lie outside the bounds of some plots. Best linear (red solid line) and quadratic (blue dashed line) fits to the selected data points are overplotted.
Current usage metrics show cumulative count of Article Views (full-text article views including HTML views, PDF and ePub downloads, according to the available data) and Abstracts Views on Vision4Press platform.
Data correspond to usage on the plateform after 2015. The current usage metrics is available 48-96 hours after online publication and is updated daily on week days.
Initial download of the metrics may take a while.