Fig. 1
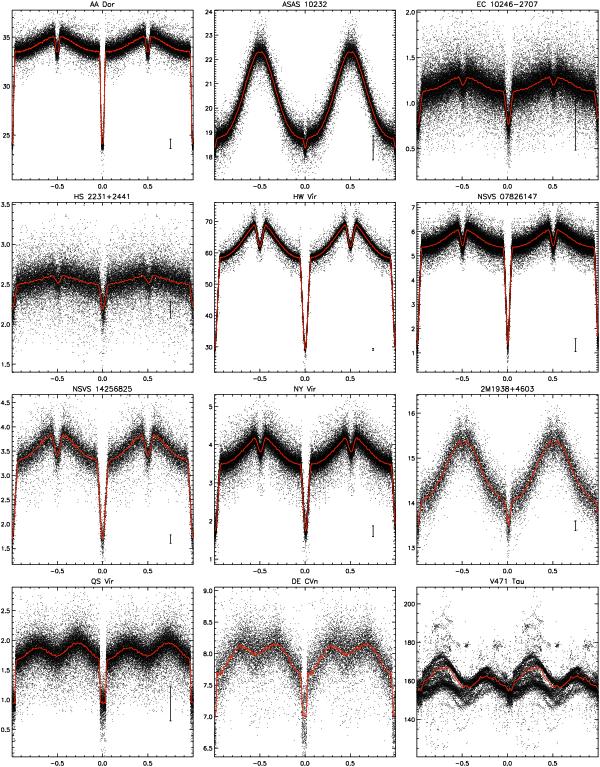
SuperWASP light curves for 12 eclipsing PCEBs phase-folded at periods given in Table 1, with binned mean curves overplotted in red (online only). The x axes indicate phase; the y axes SuperWASP flux in arbitrary units (pseudo-V magnitudes are given by 15 − 2.5log (flux). A typical point’s uncertainty is shown in the bottom right of each panel.
Current usage metrics show cumulative count of Article Views (full-text article views including HTML views, PDF and ePub downloads, according to the available data) and Abstracts Views on Vision4Press platform.
Data correspond to usage on the plateform after 2015. The current usage metrics is available 48-96 hours after online publication and is updated daily on week days.
Initial download of the metrics may take a while.