| Issue |
A&A
Volume 566, June 2014
|
|
|---|---|---|
| Article Number | A109 | |
| Number of page(s) | 8 | |
| Section | Galactic structure, stellar clusters and populations | |
| DOI | https://doi.org/10.1051/0004-6361/201423722 | |
| Published online | 20 June 2014 | |
Lithium and oxygen in globular cluster dwarfs and the early disc accretion scenario
1 Astrophysics Research Institute, Liverpool John Moores University, IC2, Liverpool Science Park, 146 Brownlow Hill, Liverpool L3 5RF, UK
e-mail: M.Salaris@ljmu.ac.uk
2 INAF − Osservatorio Astronomico di Collurania, via M. Maggini, 64100 Teramo, Italy
e-mail: cassisi@oa-teramo.inaf.it
Received: 27 February 2014
Accepted: 22 April 2014
A new scenario – early disc accretion – has recently been proposed to explain the discovery of multiple stellar populations in Galactic globular clusters. According to this model, the existence of well defined (anti-)correlations amongst light element abundances (i.e. C, N, O, Na) in the photospheres of stars belonging to the same cluster (and the associated helium enrichment) is caused by accretion of the ejecta of short-lived interacting massive binary systems (and single fast rotating massive stars) on fully convective pre-main sequence low- and very low-mass stars, during the early stages of the cluster evolution. In a previous paper we applied this scenario to the cluster NGC 2808, showing how the knowledge of the He abundance of its triple main sequence can constrain both the He abundance of the accreted matter and the accretion efficiency. Here we have investigated the constraints provided by considering simultaneously the observed spread of lithium and oxygen (and when possible also sodium) abundances for samples of turn-off stars in NGC 6752, NGC 6121 (M4), and NGC 104 (47Tuc), and the helium abundance of their multiple main sequences. These observations provide a very powerful test of the accretion scenario, because the observed O, Li, and He abundance distributions at the turn-off can be used to constrain the composition (and mass) of the accreted matter and the timescales of the polluting stars. In the case of NGC 6752, we could not find a physically consistent solution. If early disc accretion does happen, observations point towards accretion of gas with a non-negligible Li abundance, contrary to the expectations for the ejecta of the “natural” polluters in this scenario. For M4, spectroscopic errors are too large compared to the intrinsic spread, to constrain the properties of the accreted matter. As for 47Tuc, we could find a physically consistent solution for the abundances of He and O (and Na) in the accreted gas and predict the abundances of these elements in the accreted matter – that will have to be reproduced by evolutionary calculations for the polluters and simulations of the global evolution of the intracluster gas – only if pollution happens with timescales of ~1 Myr, so polluters are objects with masses of several tens of solar masses. Accurate spectroscopic measurements of Li and other light elements in dwarf stars in a larger sample of clusters are needed to test this scenario more comprehensively.
Key words: globular clusters: general / globular clusters: individual: NGC 6121 / globular clusters: individual: NGC 6752 / globular clusters: individual: NGC 104 / stars: abundances
© ESO, 2014
1. Introduction
In the last ten years, our “classical” view of Galactic globular clusters (GGCs) as simple (single-age, single initial chemical composition) stellar populations has been severely challenged by a plethora of photometric and spectroscopic observations (see e.g. Gratton et al. 2012; Piotto et al. 2012, and references therein for reviews). We now know that probably each cluster hosts distinct stellar populations, each one with its own chemical abundance pattern characterised by light element (anti-)correlations (a range of C and O depletions, and of N and Na enhancements, compared to the standard α-enhanced metal distribution typical of the halo field population) and moderate (sometimes also large) helium enhancements. Depending on the photometric filters (see i.e. Sbordone et al. 2011; Cassisi et al. 2013), the various sub-populations may be located on separate sequences in the colour–magnitude diagrams, due to the effect of the different abundance distributions on isochrones and bolometric corrections. This broad picture is nowadays denoted as the “multiple population phenomenon”.
The challenge is to understand how distinct sub-populations may have formed in the early stage of the cluster’s life. All the main proposed scenarios (Decressin et al. 2007b; D’Ercole et al. 2008, 2011; Conroy & Spergel 2011; Valcarce & Catelan 2011) envisage the chemical patterns being produced by multiple star formation bursts during the early stages of the evolution of clusters. After a first generation (FG) of stars with He abundances and metal abundance ratios typical of the halo field population is formed, subsequent generations within a cluster (SG stars) form from matter ejected by preexisting FG stars (polluters), diluted with material of FG composition not yet involved in star formation episodes. The main difference among the various scenarios is related to the nature of the stellar polluters: intermediate-mass asymptotic giant branch stars (see e.g. D’Ercole et al. 2008), fast rotating massive star (FRMS; see e.g. Decressin et al. 2007b), or interacting massive binary star (IMBS; see e.g. de Mink et al. 2009) systems are able to eject in the intracluster medium matter with appropriately varied light-element abundances and He-enhancement, as a consequence of the nuclear processes associated to high temperature proton captures during H-burning. An additional difference related to the nature of the polluters, is the amount of dilution needed to explain the abundances of SG stars; this dilution with pristine material (with FG composition) is necessary for reproducing the observed abundance patterns appropriately.
These scenarios encounter some difficulties: i) no convincing physical mechanism(s) has (have) been envisaged that enable a star-forming cluster to keep a significant amount of cold pristine gas; ii) to explain the actual ratio of SG to FG stars (Carretta et al. 2009b), the amount of polluting matter has to be extremely large, although only a relatively small fraction of FG stars is contained in the candidate polluters (for a standard initial mass function). This implies that the present GGCs had to be more massive by a factor 10−100 at birth, at odds with empirical constraints based on observations of the GC system in the Fornax dwarf galaxy (see Larsen et al. 2012, and references therein). Also, surveys of Galactic and extragalactic massive young clusters with ages between 10 Myr and 1 Gyr – assumed to be the counterpart of GGCs at an early evolutionary stage – do not show any evidence of ongoing star formation (Bastian et al. 2013a),
A different scenario has recently been envisaged by Bastian et al. (2013b) – a variant of earlier suggestions by Dantona et al. (1983) and Thoul et al. (2002). These authors propose that a fraction of low- and very low-mass FG stars – that we denote as “unenriched” stars within this scenario – could accrete, during their fully convective pre main sequence (MS) stage, matter ejected by IMBS and possibly also FRMSs, and modify their chemical composition to match the observed abundance patterns. In this “early disc accretion” scenario, the polluting matter is mixed and diluted within the whole star well before the MS phase, and no further dilution occurs during the following red giant branch phase, in agreement with spectroscopical measurements. In more detail, this scenario envisages the following sequence of events: i) the cluster becomes gas-free after a single star formation episode with a standard initial mass function, and the more massive stars (i.e. both FRMS and IMBS objects) are strongly centrally concentrated as a consequence of mass segregation; ii) the matter ejected by these fast evolving stars is quickly accreted onto the circumstellar discs surrounding low-mass objects still on their pre-MS. The role of a circumstellar disc is to favour accretion, due to its large cross-section for this process.
Given that the ejecta of massive stars would be preferentially concentrated in the cluster core, the current number of stars with SG composition – that we denote as “enriched stars” within this scenario – and the extent of the abundance anticorrelations are modulated by the time spent in the cluster core during the pre-MS phase, and the efficiency of accretion. According to Bastian et al. (2013b), the early disc accretion scenario should be valid for all GGCs, excluding only the few ones that show an iron-abundance spread (such as ω Cen and M22).
In a recent investigation (Cassisi & Salaris 2014, hereinafter Paper I) we have tested this scenario on NGC 2808, that displays a triple MS with well defined and distinct He abundances. We were able to put tight constraints on both the minimum He-mass fraction in the accreted gas, and the accretion efficiency on the “seed” fully convective stars.
In this work we have focused on lithium and oxygen (also Na for one cluster) abundances measured at the turn-off (TO) of NGC 6752, NGC 6121 (M4) and NGC 104 (47Tuc), three GGCs that also show multiple MSs corresponding to well defined He abundances. Lithium is virtually absent in the ejecta of FRMS (de Mink et al. 2009) and IMBS polluters (see Decressin et al. 2007a; Frischknecht et al. 2010; Brott et al. 2011), and within the early disc accretion scenario the Li distribution in the polluted population is predicted to be determined by the dilution on the preexisting Li with the accreted material (and eventually pre-MS depletion due to Li-burning, see next section for details). We have investigated whether it is first possible to reproduce both the abundance of He of the multiple MSs and the measured range of Li abundances at the TO. The combination of these observations provide tight constraints on the amount of matter accreted to produce an enriched population with the observed metal distribution and He mass fraction. For each cluster, given the constraints from the Li abundance analysis, we have then determined the oxygen (and sodium for one cluster) mass fraction in the accreted gas, that is required for reproducing the observed spread of this element in the same TO stars. The results provide a crucial additional test of the viability of the early disc accretion scenario.
The next section presents the methodology of our analysis, and is followed by the presentation of the results for the individual clusters. A final discussion and conclusions close the paper.
2. Methods
The starting point of our investigation has been the current He abundance distribution of the multiple MSs observed in NGC 6752, M4 and 47Tuc, as determined by Milone et al. (2012, 2013, 2014), together with the observed spread of A(Li) at their TO, measured by Shen et al. (2010), Mucciarelli et al. (2011), and D’Orazi et al. (2010), respectively. We focus on the observed Li abundance spread, rather than the absolute abundances, because the spread does not depend on the uncertain initial value for the unpolluted stars, possible zero-point offsets of the Teff scale employed in the spectroscopic analysis (the observed stars span a narrow Teff range), and – as we will see below – the uncertain efficiency of atomic diffusion, but is a function of the amount of accreted matter in the He-enriched populations.
As shown in Paper I, for each pair of actual MS mass and He abundance Y (denoted as MMS and YMS, respectively) and an assumed He abundance Yaccr in the matter accreted by the pre-MS fully convective “seed” objects – the free parameter – it is possible to determine the corresponding amount of mass accreted ΔMaccr, according to 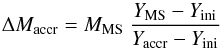 (1)where Yini is the Y abundance of the accreting “seed” stars. The condition ΔMaccr = MMS – corresponding to the maximum possible accreted mass – provides a firm lower limit for Yaccr, as discussed in Paper I. If YMS along a polluted MS is uniform, without any (small) spread, the lower limit for Yaccr is obviously given by YMS; in case of multiple He-rich sequences, this lower limit is given by YMS of the most He-rich one.
At the same time, the early accretion scenario predicts that the accreting matter is made of the virtually Li-free ejecta. This implies that the current surface Li mass fraction of the He-enriched populations – denoted here as X(Li)MS – is determined by the combined effect of dilution caused by accretion of Li-free gas, and the depletion (if any) due to Li-burning in the accreting pre-MS objects.
The typical TO-masses expected for the multiple populations in each of these target clusters are in the range MTO ~ 0.75 − 0.90 M⊙, for ages of the order of 11−13 Gyr (the precise value of the clusters’ ages does not affect any of the quantitative results presented in this section). At the clusters’ metallicities the predicted pre-MS Li-depletion for stars with these masses is negligible (Chabrier & Baraffe 1997), and – as we tested with specific calculations – is independent of the initial He abundance. This means that the Li pre-MS depletion for a TO star is determined by the depletion within the accreting progenitor at the onset of accretion, in the (reasonable, as discussed below) assumption that the duration of the accretion process is negligible compared to the typical Li-depletion timescale. We denote with tf the time when accretion is completed, assumed to be approximately equal to the time it started.
The ratio between the current Li mass fraction for a star on a He-enriched MS, and the initial value of the unpolluted accreting population is given by 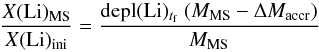 (2)where (MMS − ΔMaccr) is the initial mass of the accreting star, X(Li)ini its initial Li mass fraction, and depl(Li)tf its Li-depletion factor (the final-to-initial Li abundance ratio) at an age tf. By combining Eqs. (1) and (2) we obtain, for a given He-rich MS star with mass MMS and He mass fraction YMS,
 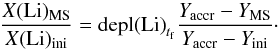 (3)By employing Yaccr = YMS in Eq. (3), that is the case of the minimum possible value for Yaccr, (X(Li)MS/X(Li)ini) = 0, an obvious consequence of the fact that the He-rich star is made of just Li-free accreted material. For increasingly large values Yaccr> YMS, the ratio (X(Li)MS/X(Li)ini) will eventually approach depl(Li)tf.
We can also generalise Eq. (3) for the case of an element i not destroyed during the pre-MS and MS, that is present in the accreted matter with a mass fraction X(i)accr, obtaining ![\begin{equation} \frac{X\rm ({\it i})_{MS}}{X\rm ({\it i})_{ini}}= \left[\left(\frac{X\rm ({\it i})_{accr}}{X\rm ({\it i})_{ini}}-1\right) \frac{Y_{\rm MS}-Y_{\rm ini}}{Y_{\rm accr}-Y_{\rm ini}}\right] + 1. \label{eqZ} \end{equation}](/articles/aa/full_html/2014/06/aa23722-14/aa23722-14-eq30.png) (4)If the “uncertain” efficiency of atomic diffusion in Population II stars (see discussions by Korn et al. 2006; Mucciarelli et al. 2011, and references therein) does not affect “differentially” the surface Li abundances of TO stars belonging to the multiple populations of a given clusters, the observed Li abundance spread at the TO can essentially be determined by comparing the distribution of the ratio (X(Li)MS/X(Li)ini) in the polluted stars obtained from Eq. (3), with (X(Li)MS/X(Li)ini) = depl(Li)tf for the initial unenriched composition.
(4)If the “uncertain” efficiency of atomic diffusion in Population II stars (see discussions by Korn et al. 2006; Mucciarelli et al. 2011, and references therein) does not affect “differentially” the surface Li abundances of TO stars belonging to the multiple populations of a given clusters, the observed Li abundance spread at the TO can essentially be determined by comparing the distribution of the ratio (X(Li)MS/X(Li)ini) in the polluted stars obtained from Eq. (3), with (X(Li)MS/X(Li)ini) = depl(Li)tf for the initial unenriched composition.
Our analysis has made use of Monte Carlo simulations for each cluster, whereby we extracted random values for the actual MS masses, between 0.1 M⊙ and the TO values of both unpolluted and He-enriched MSs, inferred from the BaSTI α-enhanced ([α/Fe] = 0.4) isochrones by Pietrinferni et al. (2006), according to a Salpeter initial mass function. This latter choice is irrelevant to our discussion, given that to date there are no estimates of the mass functions of the three MSs to compare with, and moreover it does not affect the results of our investigation. For each of these synthetic MS stars we then determined from Eq. (1) the amount of accreted mass required for reproducing the He abundance of the multiple MS, for a given value of Yaccr (the free parameter), and including a small 1σ = 0.003 spread for Y of the He-enhanced sequences (we chose this small value to account for the fact that the accretion process may not produce precisely the same Y in the stars belonging to the observed multiple MS, and at the same time to keep the multiple sequences separated in the colour magnitude diagrams, as observed; the exact value of this small spread does not affect any of the results presented in the following sections). The condition ΔMaccr = MMS for the most He-rich MS provided the lower limit for Yaccr.
For a given Yaccr we also assigned to each synthetic star a value for the ratio (X(Li)tf/X(Li)ini), according to Eq. (3) (including a Gaussian 1σ spread to mimic the observational errors), and determined the value of Yaccr necessary to match the observed Li abundance spread. The appropriate depl(Li)tf was obtained by interpolation amongst the values provided by Chabrier & Baraffe (1997), for the initial mass and total metallicity [M/H] of the synthetic accreting star.
When the observed Li abundance spread was matched by the synthetic sample with the appropriate choice of Yaccr, we employed Eq. (4) (adding an appropriate observational error) to determine the oxygen (and sodium for 47Tuc) abundances (relative to the unenriched abundances) in the accreted gas, necessary for reproducing the observed O (and Na) abundance spreads.
Before discussing the results for the individual clusters, we expand upon the issue of atomic diffusion and length of the pollution event.
-
1.
Atomic diffusion. Atomic diffusion during the MS evolution can modify the absolute values of the surface Li abundances slowly, especially close to the TO (TO stars are hotter, and their shallower convective regions induce a faster depletion of the surface Li abundance), and potentially also alter the predicted abundance spread. This is because populations with different abundances of He will have different TO masses (for a fixed age) hence different depths of the convective envelope, that mainly regulates the variation of the surface abundances. In case of the largest He abundance differences within each of the three selected clusters (δY ~ 0.02 − 0.03), we have verified with calculations of the expected TO masses at an age between 11 and 13 Gyr and the metallicities of our target clusters, that the differential effect is at most of ~0.015 dex, for fully efficient atomic diffusion, much smaller than typical spectroscopic errors (see next section). Similar result is obtained for other metals like O and Na. Additionally, spectroscopic observations of Li and Fe at the TO and RGB of GGCs show clearly that the efficiency of atomic diffusion in these stars (at least the efficiency of diffusion from their convective envelopes, see i.e. Korn et al. 2006; Mucciarelli et al. 2011, for details) is not as expected from the solution of the Burgers equations (equations that describe the element transport in a multicomponent fluid associated with diffusion; see e.g. Schlattl & Salaris 2003, and references therein), but appears to be moderated by some competing transport mechanism. We expect therefore that non-convective element transport mechanisms during the MS should not contribute to the Li abundance spread expected at the TO.
-
2.
Accretion timescales. The timing and length of the accretion process from the disc onto the “seed” object is an important parameter to determine the Li abundance in the He-enriched subpopulations. If accretion starts “too late”, Li-depletion in the accreting pre-MS fully convective stars can be so severe (depending on their mass) that the final abundances are essentially zero. The same is true if the accretion process takes a long time and Li is depleted efficiently while the mass slowly increases. The early disc accretion scenario requires accretion of polluted matter onto the pre-MS objects to be efficient within the first ~10 Myr of cluster evolution, when pre-MS low mass stars are still fully convective and retain a disc; in our calculations we set this age as an upper limit for tf, that corresponds approximately to the lifetime of a 15 M⊙ star at the typical metallicities of our clusters (Georgy et al. 2013). The lower age limit for the onset of accretion, will be ~1 Myr, corresponding to the lifetime of a 120 M⊙ metal-poor star (Georgy et al. 2013). As for the length of the accretion, at the onset of pollution − in the approximation of coeval stars – the discs around the low-mass stars are expected to be depleted of gas, and typical accretion rates at these ages for unpolluted stars are observed to be below ≈10-7 − 10-8 M⊙ yr-1 (see i.e. Manara et al. 2012). However, one expects that the swept intracluster gas replenishes the circumstellar discs and increases the accretion rates onto the pre-MS objects to values of 10-4 − 10-6 M⊙ yr-1, typical of the earlier main accretion protostellar phase (Audard et al. 2014; Dunham et al. 2014). With these rates, the accretion time to form the current TO stars would be shorter than characteristic Li-depletion timescales, and depl(Li)tf is essentially fixed by the accretor mass and the value of tf. Figure 1 displays the pre-MS Li-depletion factors at 10 Myr (the case of tf = 1 Myr corresponds to essentially no depletion) used in our calculations for the three target clusters, from Chabrier & Baraffe (1997) models; notice the strong dependence on both mass and metallicity that must be accounted for, to predict reliable (X(Li)tf/X(Li)ini) ratios. Whenever Li-burning is efficient within a convective region that reaches the surface, its photospheric abundance decreases with time. Bearing in mind that Li is burned at temperatures ~2.5 × 10⁶ K, the observed trend with mass and metallicity for these fully convective objects is caused by the interplay of pre-MS evolutionary rate, Li burning timescales, and temperature increase within the stellar structures (see Bildsten et al. 1997, for an analytic treatment of Li depletion in fully convective pre-MS stars). Uncertainties in the pre-MS Li depletion for the relevant age range arise from variations of the thermal stratification (largely adiabatic) of these fully convective models, that is mainly affected by uncertainties in the equation of state of the stellar gas, and the surface boundary conditions. Regarding the potential effect of rotation in these metal poor stars, rotationally induced MS Li depletion, after the actual TO stars have completed the pre-MS accretion, is probably negligible, for rotation rates consistent with the available observations of globular cluster MS stars (Palacios et al. 2006). A possible exception is the case of stars born with large rotation rates, that have undergone strong magnetic braking at the beginning of the MS (Palacios et al. 2006), and have built up a strong gradient of rotational velocity.
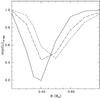 |
Fig. 1 Pre-MS Li-depletion factor (final-to-initial abundance ratio) at 10 Myr as a function of the stellar mass, from the models by Chabrier & Baraffe (1997), for the metallicities of the three selected clusters (NGC 6752 – solid line; M4 – dashed line; 47Tuc – dash-dotted line). |
3. Li and O abundance spread in TO stars
In this section we present the results of our analysis for the three target clusters. We have assumed an age t = 13 Gyr and [ Fe / H ] = − 1.6 for NGC 6752, t = 13 Gyr and [ Fe / H ] = −1.0 for M4, t = 11 Gyr and [ Fe / H ] = −0.7 for 47Tuc, close to the estimates by Salaris & Weiss (2002) and Carretta et al. (2009a) for each cluster. The precise values (that fix the TO masses for the various cluster populations and the pre-MS Li depletion) are however not critical; for example, a variation of ±1.5 Gyr around the assumed ages does not affect at all the results of our analysis.
3.1. NGC 6752
We considered the triple MS of NGC 6752 with YMS = 0.246 (unenriched), 0.254 and 0.275 (He-enhanced), respectively, as derived by Milone et al. (2013). We focused on the mass range corresponding to the magnitude interval where the triple MS can be actually separated (Milone et al. 2013). Figure 2 displays the results for a simulation with Yaccr = 0.280. This is the lower limit for the He abundance in the accreted matter to produce the two He-enhanced sequences, and has been obtained by imposing that the maximum amount of accretion satisfies the relationship ΔMaccr = MMS – e.g. accretion can be efficient also on brown dwarf objects. This lower limit is slightly higher than Yaccr = 0.275 – the value expected for ΔMaccr = MMS in case the He-enhanced sequences do not display any He spread – because of the small abundance spread assumed for the He-enriched sequences.
As obvious, the two He-enriched populations must have accreted with different efficiencies, with the more He-rich sequence displaying higher ΔMaccr values at fixed MMS. The lowest value for the accreting mass Mi is equal to about 0.4 M⊙ for the sequence with YMS = 0.275, because we are considering only the portion of the MS where multiple sequences have been detected. If the multiple sequence were to coexist down to the H-burning limit, the lowest accreting mass would obviously decrease.
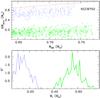 |
Fig. 2 Upper panel: mass accreted as a function of the actual MS mass (both in solar mass units, in the mass range where separate sequences are actually identified observationally) for the two He-rich sequences (dots for the MS with Y = 0.275, open circles for the MS with Y = 0.254) in NGC 6752. The dotted line is the upper bound of the region where the mass of the accretors is greater than zero. Lower panel: mass distribution of the accretors (bin size equal to 0.01 M⊙). The solid line corresponds to the seeds of the population with Y = 0.254, the dotted line is the counterpart for stars with Y = 0.275. The quantity N∗ corresponds to the number of stars per bin in our simulation, rescaled by a factor 400. |
 |
Fig. 3 Number distribution of theoretical Δ(Li) = log (X(Li)MS/X(Li)ini) values at the TO for tf = 10 Myr (dashed line) compared to observations of Li abundances in NGC 6752 (solid line). The observed abundances have been shifted to make their mean value match the mean value of Δ(Li). The theoretical number distribution has been rescaled to match the total number of stars with Li measurements. The histogram bin size is equal to 0.12 dex. |
Regarding the observed Li abundances at the TO, spectroscopic measurements of 118 stars by Shen et al. (2010) derived a substantial 1σ spread of 0.15 dex, larger than the typical 1σ = 0.09 dex observational error (that we added as a Gaussian error to the theoretical log (X(Li)tf/X(Li)ini) values). We have considered only stars within 0.006 M⊙ of the TO masses of the three populations (the exact value of this mass range does not change the results), to mimic samples of observed TO stars, and 30:40:30 number ratios between objects with Y = 0.246, 0.254 and 0.275, respectively, in agreement with the estimates by Milone et al. (2013). We note again that we consider (X(Li)MS/X(Li)ini) = depl(Li)tf for the unpolluted population.
With tf equal to either 1 Myr or tf = 10 Myr, He abundances Yaccr equal to 0.31 or 0.35 are required for (X(Li)tf/X(Li)ini) values of the whole TO sample (unenriched and enriched sub-populations) to reproduce the observed 1σ spread. Figure 3 compares the number distribution of log (X(Li)tf/X(Li)ini) values for the best match sample of synthetic TO stars (200 objects) including all three populations (30:40:30 ratios) with the empirical measurements, for the case of Yaccr = 0.35 and tf = 10 Myr; the observed abundances were shifted to make their mean value match the mean value of log (X(Li)tf/X(Li)ini). The theoretical number distribution has been rescaled to match the observed total number of stars with spectroscopic measurements of Li.
Additionally we tested with a KS-test that the whole Li distribution of the best match synthetic samples and the observed one (absolute values shifted as described before) are consistent. As customary, we considered the distributions to be different when the KS-test returns a 95% probability of a significat difference. Here, and for all cases discussed below, this probability is always around 50% or less.
The increase of Yaccr for tf = 10 Myr is the logical consequence of pre-MS Li-depletion affecting low mass stars at this age, that demands a smaller dilution due to accretion (hence less accreted mass and higher Yaccr) for reproducing the observed Li spread. The mean mass ratios between actual and initial mass of the TO stars are equal to 1.13 and 1.08 for the Y = 0.254 population, and 1.85 and 1.38 for the Y = 0.275 population. The mean values of log (X(Li)tf/X(Li)ini) for the whole TO sample are equal to −0.12 and −0.10 for the two choices of tf.
The spectroscopic measurements by Shen et al. (2010) provided also O abundances for TO stars, with a typical 1σ = 0.14 dex error on the individual estimates. The resulting 1σ spread of the O abundance distribution is equal to 0.28 dex. We have attempted to match the observed O abundance spread with the range of log (X(O)MS/X(O)ini) obtained from Eq. (4) (considering log (X(O)MS/ X(O)ini) = 0 for the unpolluted stars) by calibrating the ratio (X(O)accr/X(O)ini) for Yaccr fixed to the values obtained from the Li abundance spread analysis. We also included a Gaussian 1σ = 0.14 dex random errors for all cluster populations to mimick the observations.
The maximum spread obtained from our simulations corresponds to the case of no oxygen in the accreted matter, that causes the maximum possible dilution in the He-enhanced populations. Even in this extreme case we could not match the observed 1σ = 0.28 dex spread for both choices of tf. Instead we obtained values equal to 0.18 dex for tf = 1 Myr and 0.15 dex for tf = 10 Myr.
In the comparison of the observed Li and O abundances with our simulations we have employed Shen et al. (2010) results, discarding objects with only upper limit abundance estimates. As an additional check, we have also used the much smaller sample of Li measurements for 9 TO stars by Pasquini et al. (2005). The abundance spread is the same (and the 1σ observational error is also very similar) as the case of Shen et al. (2010). These authors discuss also O abundances for the same stars taken from Carretta et al. (2005). Using this smaller set of Li and O abundances we were again unable to match both observed Li and O abundance ranges with our simulations.
3.2. M4
Deep optical and near-infrared photometries of M4 have disclosed a double sequence at the bottom of the MS (Milone et al. 2014), corresponding to initial Y values equal to 0.25 (unenriched) and 0.27 (He-enhanced). The split MS cannot be traced up to the TO region, but we make the reasonable assumption that the whole MS is separated into these two components.
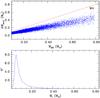 |
Fig. 4 As Fig. 2 but for the He-rich MS of M4. The quantity N∗ corresponds to the number of stars per bin in our simulation, rescaled by a factor 400. |
Monte Carlo simulations using Eq. (1) to determine ΔMaccr as a function Yaccr, provide a lower limit Yaccr = 0.285 (see Fig. 4) to produce the observed He-enhanced sequence.
Spectroscopic observations by Mucciarelli et al. (2011) of a sample of 31 TO stars determined a 1σ = 0.10 dex Li abundance spread, consistent with the size of the estimated observational errors. Our simulations that make use of Eq. (3) (including a Gaussian 1σ = 0.10 dex spread, to mimic the observational errors) could reproduce the observed Li spread with Yaccr equal to 0.39 and 0.45, for tf = 1 Myr and 10 Myr, respectively (see Fig. 5 for a sample of 200 objects and the case tf = 10 Myr). A KS-test also confirmed the agreement between synthetic and observed Li abundance samples for these parameters (with the measured abundances shifted to match the mean value of log (X(Li)tf/X(Li)ini)). This result does not depend critically on the number ratio between the two populations (that we assumed to be 40:60 between unpolluted and He-enhanced stars, following Milone et al. 2014) given that for the spread to be equal to the observational errors, the Li abundance distribution – in our case the distribution of (X(Li)tf/X(Li)ini) ratios – must be essentially the same for both groups of stars (see also Mucciarelli et al. 2011). The relatively high Yaccr is required to keep ΔMaccr small, and causes a very small Li dilution within the He-enriched population, to match the observations. As a consequence, the mean mass ratio between actual and initial mass of the He-enhanced TO stars is close to unity, equal to 1.16 and 1.11, for tf = 1 Myr and 10 Myr respectively. The corresponding mean values of log (X(Li)tf/X(Li)ini) are −0.04 and −0.05 dex.
The analysis by Mucciarelli et al. (2011) provided also O abundances for the TO stars, characterized by a 1σ = 0.15 dex error on the individual estimates; the resulting O abundance distribution displays a 1σ spread also equal to 0.15 dex. Calculations as those done for NGC 6752 revealed that the data cannot provide any constraint on the O abundance in the polluting matter, given that the observed spread is dominated by the spectroscopic error. Any value of the oxygen abundance in the accreted matter between the unpolluted value X(Li)ini and zero (the accreting matter must be O-depleted for reproducing the observed abundance patterns of enriched stars) reproduces the observed spread for both choices of tf, once the observational error is included in the theoretical simulations, and satisfies simultaneously the KS-test.
3.3. 47Tuc
The study by Milone et al. (2012) has disclosed a double MS for 47Tuc, corresponding to a standard initial He abundance Y = 0.25, and a He-enhanced one with Y = 0.265. We have determined a lower limit Yaccr = 0.270 (when considering the small abundance spread along the He-enhanced sequence) to produce the He-enhanced MS (see Fig. 6, that displays the mass interval where the double MS is detected).
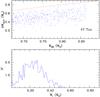 |
Fig. 6 As Fig. 2 but for the He-rich MS of 47Tuc. The quantity N∗ corresponds to the number of stars per bin in our simulation, rescaled by a factor 10. |
Regarding Li abundances, the spectroscopic analysis by D’Orazi et al. (2010) determined a spread 1σ = 0.20 dex for a sample of 71 TO stars, much larger than the average observational error (1σ = 0.08 dex)1. Our simulations (that include a 1σ = 0.08 dex random Gaussian observational spread) were able to reproduce the observed Li spread with Yaccr, equal to 0.278 and 0.30, for tf = 1 Myr and 10 Myr, respectively (see Fig. 7 for a sample of 200 synthetic objects and the case tf = 10 Myr). We considered a 30:70 ratio between He-normal and He-enhanced TO stars, according to the observed ratio of O-normal to O-depleted stars in the TO sample with Li measurements by D’Orazi et al. (2010). A KS-test confirms the agreement between the Li abundance synthetic samples and the observed one (with the measured abundances suitably shifted as described for NGC 6752 and M4). The mean value of log (X(Li)tf/X(Li)ini) is equal to −0.18 for both assumptions about tf, and the corresponding mean mass ratios between actual and initial mass of the He-enhanced TO stars are equal to 2.23 and 1.43, respectively.
D’Orazi et al. (2010) study provided also abundances of O and Na for TO stars, characterized by a 1σ spread equal to 0.16 dex and 0.18 dex, respectively. Using Eq. (4) together with random Gaussian 1σ errors equal to 0.06 dex for O and 0.10 dex for Na (equal to the spectroscopic errors), we found that for tf = 1 Myr (Yaccr = 0.278), both O and Na abundance spreads could be reproduced for chemical abundances in the ejecta equal to (X(O)accr/X(O)ini) = 0.1 and (X(Na)accr/X(Na)ini) = 3. We display in Fig. 8 the observed Li-O and Li-Na abundance-abundance patterns, compared to the results from this synthetic sample with Yaccr = 0.278. The simulation predicts log(X(i)MS/X(i)ini) ratios of Li, O and Na for each synthetic star, and the observed abundances have been shifted to match the mean values of these ratios. A KS-test also confirms the agreement between the abundance of both Na and O of the synthetic samples, and the observed values (shifted as in Fig. 8).
In case of tf = 10 Myr (Yaccr = 0.30) it was not possible to match the observed spread of O, even assuming (X(O)accr/X(O)ini) = 0 (we obtained a maximum 1σ spread equal to 0.10 dex), whilst the Na abundance spread was matched with (X(Na)accr/X(Na)ini) = 5.
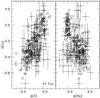 |
Fig. 8 Δ(Li) = log (X(Li)MS/X(Li)ini) vs. the corresponding values for oxygen (left panel) and sodium (right panel), for the 47Tuc best match synthetic sample with Yaccr = 0.278, (X(O)accr/ X(O)ini) = 0.1 and (X(Na)accr/ X(Xa)ini) = 3. The observed Li, O and Na abundances are also displayed (symbols with error bars), shifted to match the mean values of Δ(Li), Δ(O), and Δ(Na). |
4. Discussion and conclusions
An attractive feature (by no means the only one) of the early disc accretion scenario proposed by Bastian et al. (2013b) to explain the GGC multipopulation phenomenon, is that it can easily be subject to stringent tests when abundance estimates are available for He, Li and elements involved in the observed anticorrelation patterns. We have expanded upon our first analysis of Paper I, by considering three clusters (NGC 6752, M4 and 47Tuc) with abundance estimates for Li and O (also Na for 47Tuc) in samples of TO stars, and with multiple MSs with well defined He abundances.
The He abundances along the MS of each clusters, together with the measured range of Li, have allowed us to put tight constraints on the amount of matter accreted by enriched stars, and its He mass fraction. These latter abundances are well within the values expected in the ejecta of IMBS or FMRS polluters. For the amount of accreted matter fixed by the Li analysis, we have then determined its O (and Na for 47Tuc) content, using the observed spread in TO stars as constraint.
We could not draw any conclusion from M4 O abundance measurements, because the observed spread is dominated by the observational error. Any abundance in the accreted gas between the unenriched value and zero can satisfy the observations.
As for 47Tuc, we found that the observed abundance spread of O and Na can be simultaneously matched when tf = 1 Myr and Yaccr = 0.278 – very close to the lower limit for Yaccr discussed in Sect. 3.3 – if (X(O)accr/X(O)ini) = 0.1 and (X(Na)accr/X(Na)ini) = 3. This match cannot be achieved for tf = 10 Myr. This points towards stars with mass equal to several tens of solar masses as the source of the pollution. It has to be seen whether detailed IMBS and FRMS calculations for the appropriate cluster metallicity provide these chemical abundances (and enough matter with this composition) in the ejecta of models with the right evolutionary timescales, and whether simulations of the global evolution of the intracluster gas predict the right amount of accretion with this chemical composition.
The situation is much more unfavourable for NGC 6752. The oxygen spread cannot be matched for any choice of tf, even for oxygen-free accreted gas. This result confirms the conclusions by Shen et al. (2010), whose data we have employed in our analysis. The problem is that the measured Li abundance spread is (even considering differences in the spectroscopic errors) smaller than the O abundance range. Given that the accreted matter has to be Li-free (FMRS and IMBS are the polluters in this scenario) the maximum dilution of oxygen in the final enriched composition cannot exceed the dilution of Li. It is therefore impossible to satisfy simultaneously both observed O- and Li abundance spread. Essentially, a higher amount of accreted matter (hence lower Yaccr) is needed for reproducing the O abundance range. An increased efficiency of pre-MS Li-burning in the “seed” objects – due for example to short bursts of very high accretion rates, as explored at solar metallicity by Baraffe & Chabrier (2010) – would exacerbate the problem, because one would need a smaller dilution – hence less matter accretion – for reproducing the Li abundance range.
In general, both O and Li abundance measurements are dominated by errors in Teff and in equivalent width measurement (Shen et al. 2010). It is important to stress that the relative abundances of Li and O are relevant to this analysis, not the absolute values, and also that we are dealing with objects (TO stars) covering a narrow range of Teff and surface gravity. As discussed by Shen et al. (2010), there are for example uncertainties in the absolute values of the oxygen abundances obtained from the OI (777.1−777.5 nm) triplet lines used for the abundance determination, but the relative values (hence the measured spread) are expected to be much more reliable.
Notice also that the same conclusions regarding NGC 6752 are found when using the smaller sample of TO stars studied by Pasquini et al. (2005). These same authors also noticed that in their stars the observed spread of O abundances is larger than the Li spread.
A possible solution of this problem envisages pre-mixing of IMBS and/or FRMS ejecta with non Li-free gas. We performed some test simulations and derived that agreement with the observed Li and O spread, and the He abundances along the triple MS, can be achieved with Yaccr ~ 0.285 – close to the minimum possible value – tf = 1 Myr (hence no pre-MS Li-depletion), (X(O)accr/X(O)ini) ~ 0.01 and (X(Li)accr/X(Li)ini) ~ 0.3. If the gas involved in the pre-mixing before accretion is characterized by an abundance of Li equal to the unenriched composition, about 50% of the matter polluting pre-MS stars had to come from this external source. Notice also the extremely low oxygen abundance to be accreted. Of course, the need of an (additional) rather ad hoc dilution process introduces an unwelcomed fine-tuning in the early disc accretion scenario to explain NGC 6752.
To summarize, we have shown how TO abundances of Li and O and estimates of He along the MS can provide stringent tests of the early disc accretion scenario. In particular, it is possible to put tight constraints on the amount of matter accreted by the unenriched “seed” stars, He and O content of the accreted gas, the timescales of the polluters.
Of the three clusters investigated, the abundances in NGC 6752 appear to be difficult to reproduce. Accurate TO spectroscopic measurements, and estimates of the He abundance along the MS of more clusters are needed to test more comprehensively this scenario.
The very recent study of Li abundances at the TO of this cluster by Dobrovolskas et al. (2014) retrieves the same abundance spread, with a typical 1σ spectroscopic error also equal to that of D’Orazi et al. (2010). The absolute values – irrelevant to our analysis – are however smaller by about 0.3 dex on average, due to the use of a 3D NLTE spectral synthesis.
Acknowledgments
We warmly thank P. Bonifacio for providing us with the results for the lithium and oxygen abundances in NGC 6752, A. Mucciarelli for the oxygen abundances in M4, S. Longmore for enlightening discussions about star formation and disc accretion, and the anonymous referee for several comments that helped to improve the presentation of our results. S.C. acknowledges financial support from PRIN-INAF 2011 “Multiple Populations in Globular Clusters: their role in the Galaxy assembly” (PI: E. Carretta), and from PRIN MIUR 2010-2011, project “The Chemical and Dynamical Evolution of the Milky Way and Local Group Galaxies”, prot. 2010LY5N2T (PI: F. Matteucci).
References
- Audard, M., Ábrahám, P., Dunham, M. M., et al. 2014, in Protostars and Planets VI, eds. H. Beuthe et al. (University of Arizona Press), in press [arXiv:1401.3368] [Google Scholar]
- Baraffe, I., & Chabrier, G. 2010, A&A, 521, A44 [NASA ADS] [CrossRef] [EDP Sciences] [Google Scholar]
- Bastian, N., Cabrera-Ziri, I., Davies, B., & Larsen, S. S. 2013a, MNRAS, 436, 2852 [Google Scholar]
- Bastian, N., Lamers, H. J. G. L. M., de Mink, S. E., et al. 2013b, MNRAS, 436, 2398 [NASA ADS] [CrossRef] [MathSciNet] [Google Scholar]
- Bildsten, L., Brown, E. F., Matzner, C. D., & Ushomirsky, G. 1997, ApJ, 482, 442 [NASA ADS] [CrossRef] [Google Scholar]
- Brott, I., de Mink, S. E., Cantiello, M., et al. 2011, A&A, 530, A115 [NASA ADS] [CrossRef] [EDP Sciences] [Google Scholar]
- Carretta, E., Gratton, R. G., Lucatello, S., Bragaglia, A., & Bonifacio, P. 2005, A&A, 433, 597 [NASA ADS] [CrossRef] [EDP Sciences] [Google Scholar]
- Carretta, E., Bragaglia, A., Gratton, R., D’Orazi, V., & Lucatello, S. 2009a, A&A, 508, 695 [NASA ADS] [CrossRef] [EDP Sciences] [Google Scholar]
- Carretta, E., Bragaglia, A., Gratton, R., & Lucatello, S. 2009b, A&A, 505, 139 [NASA ADS] [CrossRef] [EDP Sciences] [Google Scholar]
- Cassisi, S., & Salaris, M. 2014, A&A, 563, A10 [NASA ADS] [CrossRef] [EDP Sciences] [Google Scholar]
- Cassisi, S., Mucciarelli, A., Pietrinferni, A., Salaris, M., & Ferguson, J. 2013, A&A, 554, A19 [EDP Sciences] [Google Scholar]
- Chabrier, G., & Baraffe, I. 1997, A&A, 327, 1039 [NASA ADS] [Google Scholar]
- Conroy, C., & Spergel, D. N. 2011, ApJ, 726, 36 [NASA ADS] [CrossRef] [Google Scholar]
- Dantona, F., Gratton, R., & Chieffi, A. 1983, Mem. Soc. Astron. It., 54, 173 [Google Scholar]
- D’Ercole, A., Vesperini, E., D’Antona, F., McMillan, S. L. W., & Recchi, S. 2008, MNRAS, 391, 825 [NASA ADS] [CrossRef] [Google Scholar]
- D’Ercole, A., D’Antona, F., & Vesperini, E. 2011, MNRAS, 415, 1304 [NASA ADS] [CrossRef] [MathSciNet] [Google Scholar]
- D’Orazi, V., Lucatello, S., Gratton, R., et al. 2010, ApJ, 713, L1 [NASA ADS] [CrossRef] [Google Scholar]
- de Mink, S. E., Pols, O. R., Langer, N., & Izzard, R. G. 2009, A&A, 507, L1 [NASA ADS] [CrossRef] [EDP Sciences] [Google Scholar]
- Decressin, T., Charbonnel, C., & Meynet, G. 2007a, A&A, 475, 859 [NASA ADS] [CrossRef] [EDP Sciences] [Google Scholar]
- Decressin, T., Meynet, G., Charbonnel, C., Prantzos, N., & Ekström, S. 2007b, A&A, 464, 1029 [NASA ADS] [CrossRef] [EDP Sciences] [Google Scholar]
- Dobrovolskas, V., Kučinskas, A., Bonifacio, P., et al. 2014, A&A, 565, A121 [NASA ADS] [CrossRef] [EDP Sciences] [Google Scholar]
- Dunham, M. M., Stutz, A. M., Allen, L. E., et al. 2014, in Protostars and Planets VI, eds. H. Beuther et al. (University of Arizona Press), in press [arXiv:1401.1809] [Google Scholar]
- Frischknecht, U., Hirschi, R., Meynet, G., et al. 2010, A&A, 522, A39 [NASA ADS] [CrossRef] [EDP Sciences] [Google Scholar]
- Georgy, C., Ekström, S., Eggenberger, P., et al. 2013, A&A, 558, A103 [NASA ADS] [CrossRef] [EDP Sciences] [Google Scholar]
- Gratton, R. G., Carretta, E., & Bragaglia, A. 2012, A&ARv, 20, 50 [CrossRef] [Google Scholar]
- Korn, A. J., Grundahl, F., Richard, O., et al. 2006, Nature, 442, 657 [Google Scholar]
- Larsen, S. S., Strader, J., & Brodie, J. P. 2012, A&A, 544, L14 [NASA ADS] [CrossRef] [EDP Sciences] [Google Scholar]
- Manara, C. F., Robberto, M., Da Rio, N., et al. 2012, ApJ, 755, 154 [NASA ADS] [CrossRef] [Google Scholar]
- Milone, A. P., Piotto, G., Bedin, L. R., et al. 2012, ApJ, 744, 58 [NASA ADS] [CrossRef] [Google Scholar]
- Milone, A. P., Marino, A. F., Piotto, G., et al. 2013, ApJ, 767, 120 [NASA ADS] [CrossRef] [Google Scholar]
- Milone, A. P., Marino, A. F., Bedin, L. R., et al. 2014, MNRAS, 439, 1588 [NASA ADS] [CrossRef] [Google Scholar]
- Mucciarelli, A., Salaris, M., Lovisi, L., et al. 2011, MNRAS, 412, 81 [NASA ADS] [CrossRef] [Google Scholar]
- Palacios, A., Charbonnel, C., Talon, S., & Siess, L. 2006, A&A, 453, 261 [NASA ADS] [CrossRef] [EDP Sciences] [Google Scholar]
- Pasquini, L., Bonifacio, P., Molaro, P., et al. 2005, A&A, 441, 549 [NASA ADS] [CrossRef] [EDP Sciences] [Google Scholar]
- Pietrinferni, A., Cassisi, S., Salaris, M., & Castelli, F. 2006, ApJ, 642, 797 [NASA ADS] [CrossRef] [Google Scholar]
- Piotto, G., Milone, A. P., Anderson, J., et al. 2012, ApJ, 760, 39 [NASA ADS] [CrossRef] [Google Scholar]
- Salaris, M., & Weiss, A. 2002, A&A, 388, 492 [NASA ADS] [CrossRef] [EDP Sciences] [Google Scholar]
- Sbordone, L., Salaris, M., Weiss, A., & Cassisi, S. 2011, A&A, 534, A9 [NASA ADS] [CrossRef] [EDP Sciences] [Google Scholar]
- Schlattl, H., & Salaris, M. 2003, A&A, 402, 29 [NASA ADS] [CrossRef] [EDP Sciences] [Google Scholar]
- Shen, Z.-X., Bonifacio, P., Pasquini, L., & Zaggia, S. 2010, A&A, 524, L2 [NASA ADS] [CrossRef] [EDP Sciences] [Google Scholar]
- Thoul, A., Jorissen, A., Goriely, S., et al. 2002, A&A, 383, 491 [NASA ADS] [CrossRef] [EDP Sciences] [Google Scholar]
- Valcarce, A. A. R., & Catelan, M. 2011, A&A, 533, A120 [NASA ADS] [CrossRef] [EDP Sciences] [Google Scholar]
All Figures
|
Fig. 1 Pre-MS Li-depletion factor (final-to-initial abundance ratio) at 10 Myr as a function of the stellar mass, from the models by Chabrier & Baraffe (1997), for the metallicities of the three selected clusters (NGC 6752 – solid line; M4 – dashed line; 47Tuc – dash-dotted line). |
| In the text | |
|
Fig. 2 Upper panel: mass accreted as a function of the actual MS mass (both in solar mass units, in the mass range where separate sequences are actually identified observationally) for the two He-rich sequences (dots for the MS with Y = 0.275, open circles for the MS with Y = 0.254) in NGC 6752. The dotted line is the upper bound of the region where the mass of the accretors is greater than zero. Lower panel: mass distribution of the accretors (bin size equal to 0.01 M⊙). The solid line corresponds to the seeds of the population with Y = 0.254, the dotted line is the counterpart for stars with Y = 0.275. The quantity N∗ corresponds to the number of stars per bin in our simulation, rescaled by a factor 400. |
| In the text | |
|
Fig. 3 Number distribution of theoretical Δ(Li) = log (X(Li)MS/X(Li)ini) values at the TO for tf = 10 Myr (dashed line) compared to observations of Li abundances in NGC 6752 (solid line). The observed abundances have been shifted to make their mean value match the mean value of Δ(Li). The theoretical number distribution has been rescaled to match the total number of stars with Li measurements. The histogram bin size is equal to 0.12 dex. |
| In the text | |
|
Fig. 4 As Fig. 2 but for the He-rich MS of M4. The quantity N∗ corresponds to the number of stars per bin in our simulation, rescaled by a factor 400. |
| In the text | |
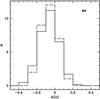 |
Fig. 5 As Fig. 3 but for the TO region of M4. The histogram bin size is equal to 0.10 dex. |
| In the text | |
|
Fig. 6 As Fig. 2 but for the He-rich MS of 47Tuc. The quantity N∗ corresponds to the number of stars per bin in our simulation, rescaled by a factor 10. |
| In the text | |
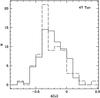 |
Fig. 7 As Fig. 3 but for the TO region of 47Tuc. The histogram bin size is equal to 0.10 dex. |
| In the text | |
|
Fig. 8 Δ(Li) = log (X(Li)MS/X(Li)ini) vs. the corresponding values for oxygen (left panel) and sodium (right panel), for the 47Tuc best match synthetic sample with Yaccr = 0.278, (X(O)accr/ X(O)ini) = 0.1 and (X(Na)accr/ X(Xa)ini) = 3. The observed Li, O and Na abundances are also displayed (symbols with error bars), shifted to match the mean values of Δ(Li), Δ(O), and Δ(Na). |
| In the text | |
Current usage metrics show cumulative count of Article Views (full-text article views including HTML views, PDF and ePub downloads, according to the available data) and Abstracts Views on Vision4Press platform.
Data correspond to usage on the plateform after 2015. The current usage metrics is available 48-96 hours after online publication and is updated daily on week days.
Initial download of the metrics may take a while.