Fig. 2
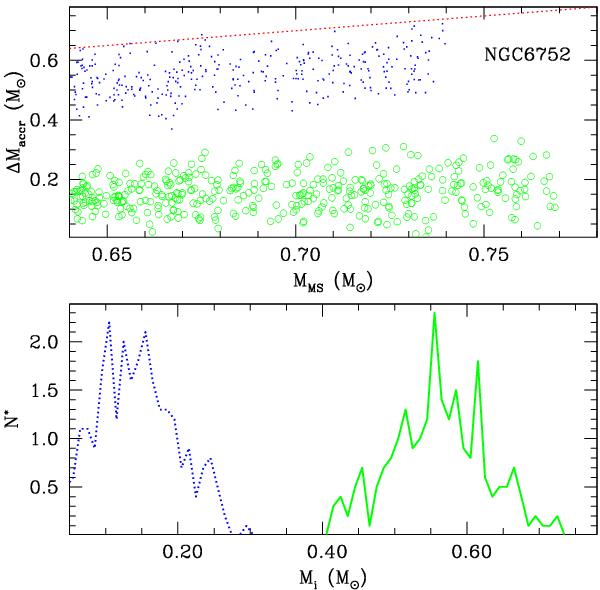
Upper panel: mass accreted as a function of the actual MS mass (both in solar mass units, in the mass range where separate sequences are actually identified observationally) for the two He-rich sequences (dots for the MS with Y = 0.275, open circles for the MS with Y = 0.254) in NGC 6752. The dotted line is the upper bound of the region where the mass of the accretors is greater than zero. Lower panel: mass distribution of the accretors (bin size equal to 0.01 M⊙). The solid line corresponds to the seeds of the population with Y = 0.254, the dotted line is the counterpart for stars with Y = 0.275. The quantity N∗ corresponds to the number of stars per bin in our simulation, rescaled by a factor 400.
Current usage metrics show cumulative count of Article Views (full-text article views including HTML views, PDF and ePub downloads, according to the available data) and Abstracts Views on Vision4Press platform.
Data correspond to usage on the plateform after 2015. The current usage metrics is available 48-96 hours after online publication and is updated daily on week days.
Initial download of the metrics may take a while.