Fig. 7
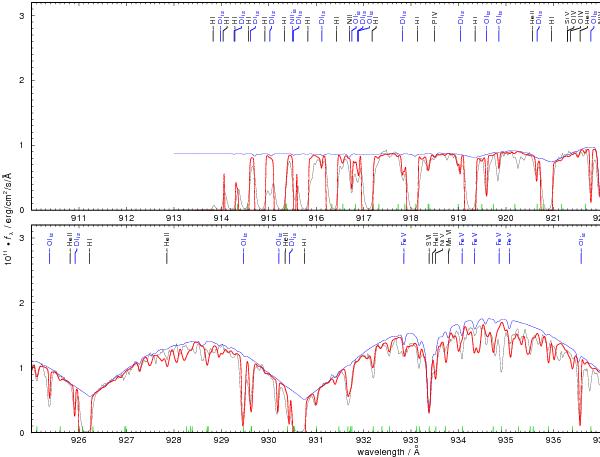
FUSE spectrum of Feige 110 (gray) compared with synthetic spectra calculated from our final model (red: Kurucz’s LIN lines and interstellar line absorption, blue: Kurucz’s POS lines). The locations of the strongest stellar (marked in black, Fe and Ni which have the most lines are marked in blue and green for clarity, respectively, for Ca–Ni, only Kurucz’s POS lines are identified) and interstellar (marked in blue, with subscript “is”) lines are indicated at the top of the panels. The small, green identification marks at the bottom of the panels indicate the locations of interstellar H2 lines.
Current usage metrics show cumulative count of Article Views (full-text article views including HTML views, PDF and ePub downloads, according to the available data) and Abstracts Views on Vision4Press platform.
Data correspond to usage on the plateform after 2015. The current usage metrics is available 48-96 hours after online publication and is updated daily on week days.
Initial download of the metrics may take a while.