Fig. 6
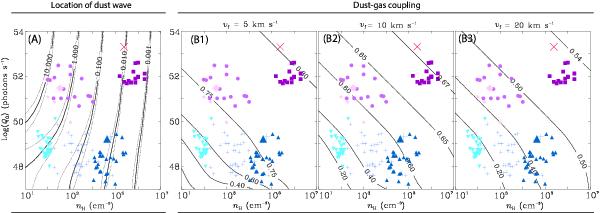
A) Location of a dust wave rmin (black contours) in pc evaluated for a grid of ionizing source luminosities Q0 and ambient densities nH for vf = 10 km s-1. The dotted contours represent rmin calculated with vf = 5 km s-1 and 20 km s-1 (a lower flow velocity will move the contours to the right in this figure). Overplotted are different astronomical objects, located in regimes drawn in Fig. 5: UC- H II /HC- H II; (Wood & Churchwell 1989), C- H II; (Garay et al. 1993) and evolved H II bubbles; (Paladini et al. 2012). We also show SSCs in the Local Group; (compiled from Turner 2009), merging galaxies; (Gilbert & Graham 2007), starburst galaxies; (McCrady & Graham 2007), and ULIRGs; (Anantharamaiah et al. 2000). Larger symbols correspond to prototypical candidates of a class denoted between brackets Fig. 5. B1), B2), and B3) coupling strength C (black contours), evaluated for a flow velocity vf = 5 km s-1, 10 km s-1, and 20 km s-1.
Current usage metrics show cumulative count of Article Views (full-text article views including HTML views, PDF and ePub downloads, according to the available data) and Abstracts Views on Vision4Press platform.
Data correspond to usage on the plateform after 2015. The current usage metrics is available 48-96 hours after online publication and is updated daily on week days.
Initial download of the metrics may take a while.