Fig. 4
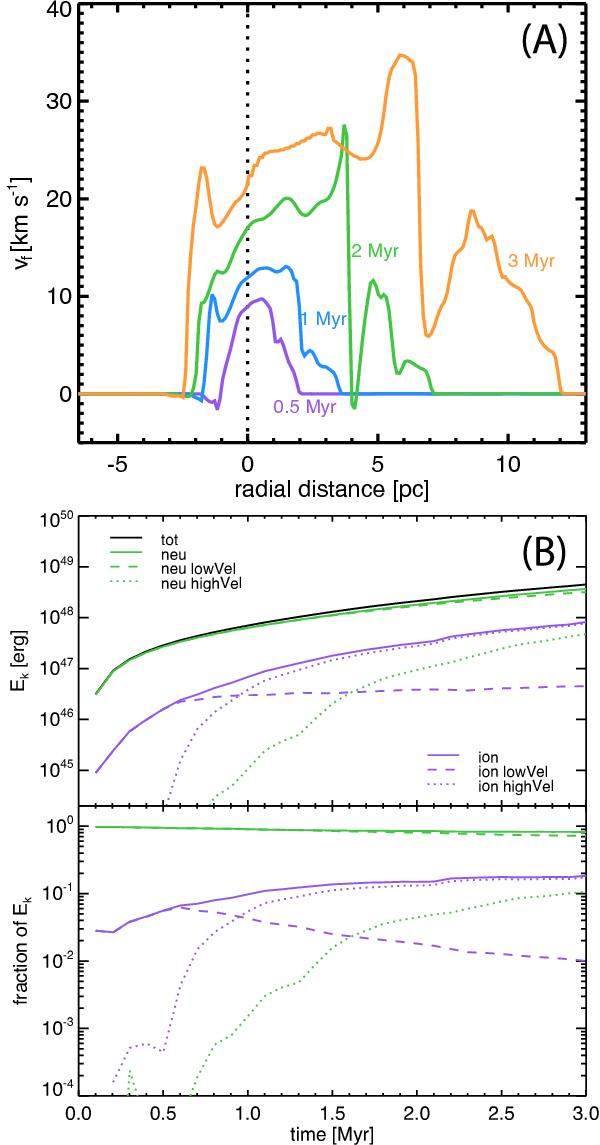
A) Gas velocity along a line in the three-dimensional simulation, which runs from the star through the opening of the bubble (as exemplified in Fig. 3). Plotted are the velocity profiles at different times t. The star is located at the dotted line. The sharp increase of the velocity close to the ionization front at t = 1 Myr and t = 3 Myr are turbulent motions induced by the finite grid of the simulation. Velocities of the gas with respect to the star range from vf = 5 to vf = 20 km s-1. B) Kinetic energy Ek contained in the three-dimensional simulation (top panel) and fractional distribution of Ek (bottom panel). We separate Ek located into the neutral gas (green), the ionized gas (purple) and their total (black line), which are further divided into the subsonic (dashed) and the supersonic (dotted) part of each component.
Current usage metrics show cumulative count of Article Views (full-text article views including HTML views, PDF and ePub downloads, according to the available data) and Abstracts Views on Vision4Press platform.
Data correspond to usage on the plateform after 2015. The current usage metrics is available 48-96 hours after online publication and is updated daily on week days.
Initial download of the metrics may take a while.