Fig. 3
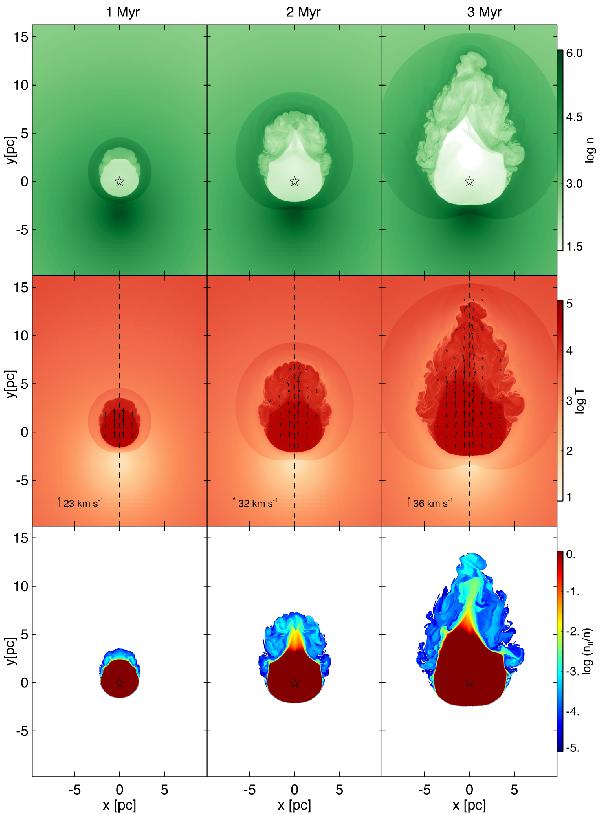
Two-dimensional hydrodynamical simulation of an expanding H II region offset from the center of a Bonnor-Ebert sphere. From top to bottom rows: the logarithm of number density n, temperature T, and ionization fraction nII/n of a slice through the yz-plane at the location of the star are shown. We trace the velocity of the gas in the three-dimensional simulation along the dashed line (see Fig. 4A). Each column corresponds to a snapshot of the simulation at 1–3 Myr. The vectors represent the velocity field in the middle row; the legend indicates the maximum velocity.
Current usage metrics show cumulative count of Article Views (full-text article views including HTML views, PDF and ePub downloads, according to the available data) and Abstracts Views on Vision4Press platform.
Data correspond to usage on the plateform after 2015. The current usage metrics is available 48-96 hours after online publication and is updated daily on week days.
Initial download of the metrics may take a while.