Free Access
Fig. 1
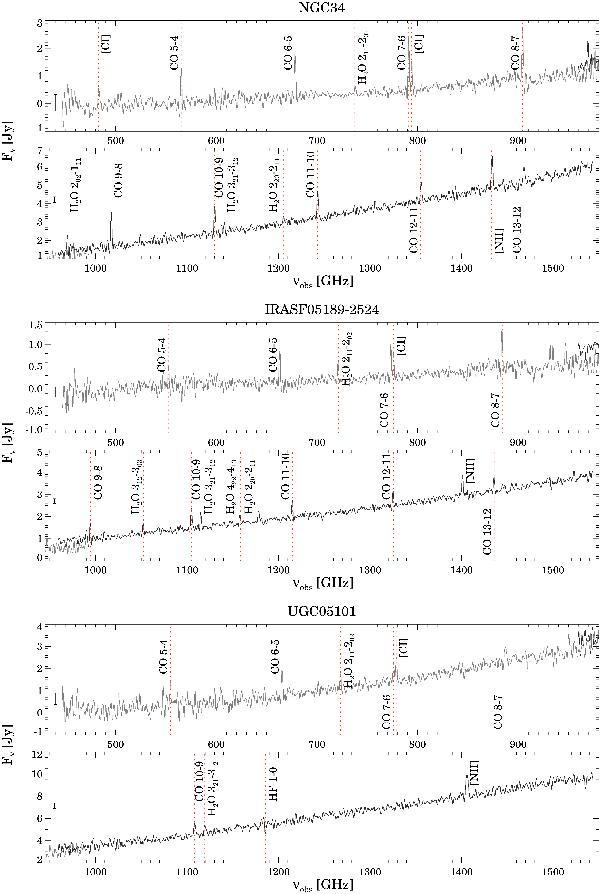
Observed SPIRE/FTS spectra of our sample. The black and gray lines are the SSW and SLW spectra, respectively. Notice the overlap between the two spectra in the 960 and 990 GHz spectral range. The dashed red lines mark the position of the detected lines. The error bars indicate the median 1σ uncertainty of each spectrum.
Current usage metrics show cumulative count of Article Views (full-text article views including HTML views, PDF and ePub downloads, according to the available data) and Abstracts Views on Vision4Press platform.
Data correspond to usage on the plateform after 2015. The current usage metrics is available 48-96 hours after online publication and is updated daily on week days.
Initial download of the metrics may take a while.