Fig. 7
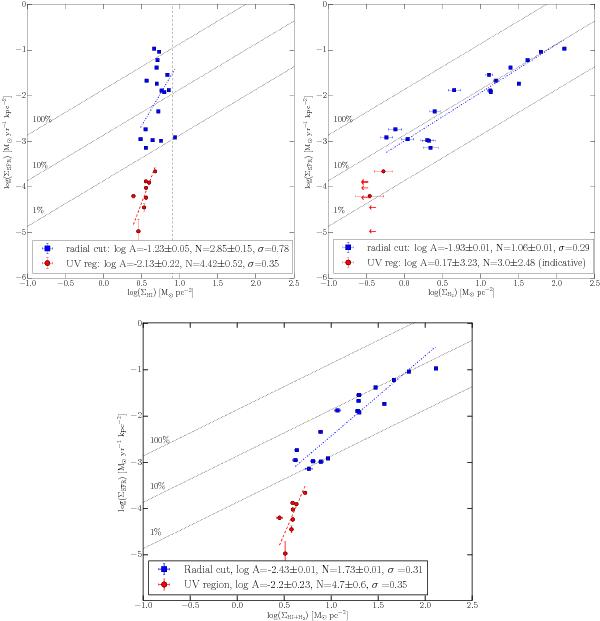
Kennicutt-Schmidt relations that relate the SFR surface density to the gas surface density plotted for ΣH I (top-left panel), ΣH2 (top-right panel), and ΣH I + H2 (bottom panel). The blue squares correspond to the 17 pointings used to map CO along the M 63 major axis (the radial cut) out to the isophotal radius, r25, and the red circles correspond to the 8 pointings with 24 μm emission detection used to map CO over the bright UV region at rgal = 1.36 r25. The K-S relation is best parametrized by a power law of the form ΣSFR = A(Σgas)N, which in log space translates into a linear relation. The best-fitting bisector linear K-S relations are derived separately for the radial cut (blue dashed-dotted lines) and for the UV region (red dashed lines). The corresponding coefficients log A and slopes N can be found in the labels of each panel. The black dotted lines represent “isochrones” of constant star formation efficiencies, indicating the level of ΣSFR needed to consume 100%, 10%, and 1% of the total amount of gas within 108 years. The vertical dashed line in the top-left panel corresponds to the ΣH I ~ 9 M⊙ pc-2 threshold at which the atomic gas saturates (Bigiel et al. 2008).
Current usage metrics show cumulative count of Article Views (full-text article views including HTML views, PDF and ePub downloads, according to the available data) and Abstracts Views on Vision4Press platform.
Data correspond to usage on the plateform after 2015. The current usage metrics is available 48-96 hours after online publication and is updated daily on week days.
Initial download of the metrics may take a while.