Fig. 6
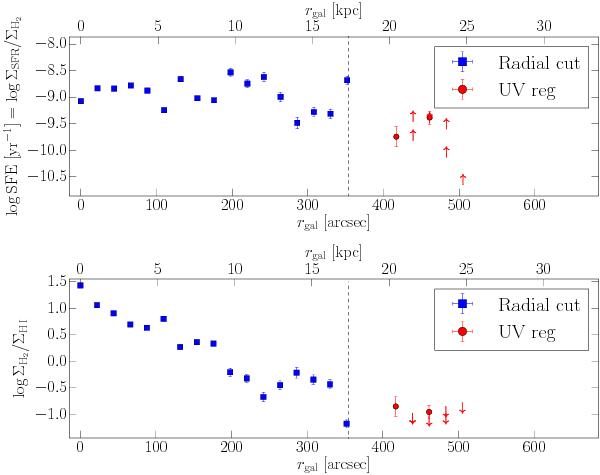
Radial profiles of the star formation efficiency (upper panel) and the H2-to-H I surface density ratio (bottom panel). The SFE is defined here as the star formation rate per unit of molecular gas. The blue squares correspond to the 17 pointings used to map CO along the M 63 major axis (the radial cut) out to the isophotal radius, r25 (dashed line), and the red circles correspond to the 8 pointings with 24 μm emission detection used to map CO over the bright UV region at rgal = 1.36 r25. The double data points plotted for the UV region at each rgal correspond to the parallel pointings used to map this region (see Table 2).
Current usage metrics show cumulative count of Article Views (full-text article views including HTML views, PDF and ePub downloads, according to the available data) and Abstracts Views on Vision4Press platform.
Data correspond to usage on the plateform after 2015. The current usage metrics is available 48-96 hours after online publication and is updated daily on week days.
Initial download of the metrics may take a while.