Fig. 5
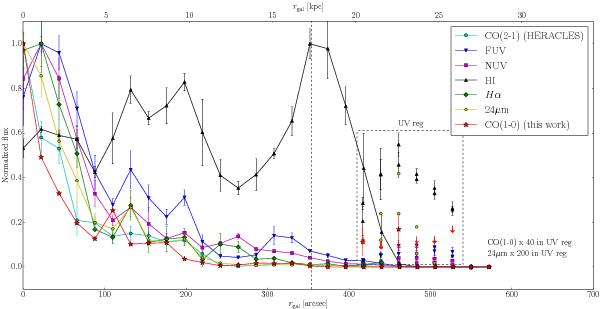
Radial profiles of FUV, NUV, Hα, 24 μm, different star formation tracers, and H I taken from the literature (see Table 3), as measured along the major axis of the M 63 disk, which we compare to our CO(1–0) radial profile (red stars) and to the CO(2–1) radial profile from the HERACLES survey (Leroy et al. 2009). The measured fluxes are plotted in a normalized flux scale in order to allow relative comparisons. All the star formation tracers nicely follow the spiral arm structure at rgal ≃ 130, 200, and probably 260″. We observe a severe drop with the galactocentric radius for all star formation tracers, as well as for CO, such that close to the r25 limit (dashed line) and beyond all tracers and CO are practically absent with the exception of UV and H I. The CO emission is again detected in the external bright UV region. The measurements obtained in this UV region are shown in the dashed box at the correct galactocentric radii. The CO(1–0) and 24 μm fluxes are multiplied by a factor of 40 and 200, respectively, to make them visible. The double data points plotted at each rgal correspond to the parallel pointings used to map the UV region (see Table 2). This external UV region has relatively high FUV and NUV emissions and is dominated by H I.
Current usage metrics show cumulative count of Article Views (full-text article views including HTML views, PDF and ePub downloads, according to the available data) and Abstracts Views on Vision4Press platform.
Data correspond to usage on the plateform after 2015. The current usage metrics is available 48-96 hours after online publication and is updated daily on week days.
Initial download of the metrics may take a while.