Fig. 2
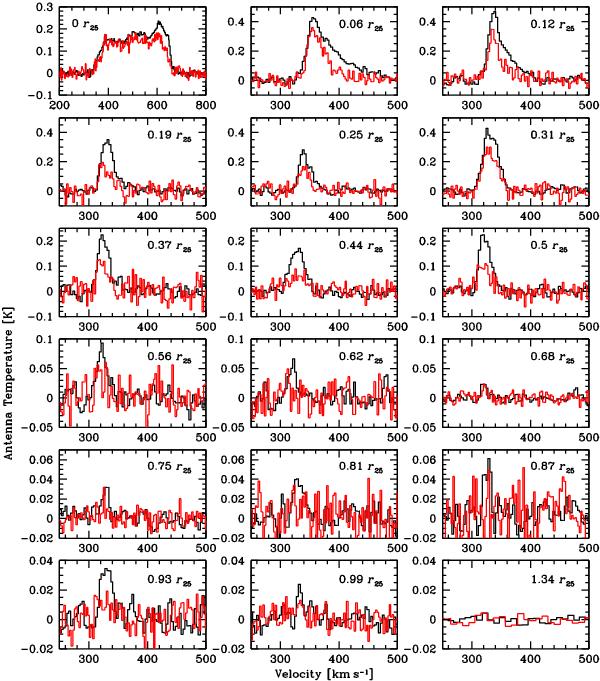
Mosaic of CO spectra obtained when mapping the M 63 disk along its major axis from the center of the galaxy out to the isophotal radius, r25. The CO(2–1) spectra (red thin line) are overplotted on the CO(1–0) spectra (black thick line). While CO(1–0) is clearly detected up to the optical radius, CO(2–1) appears to be confined to rgal ≲ 0.68 r25. The bottom right hand panel shows the CO(1–0) and CO(2–1) spectra obtained when summing all scans at the ten outermost pointings from rgal = 1.06 r25 to 1.6 r25 and smoothed to a resolution of 9.7 km s-1 and 10.4 km s-1, respectively. No CO emission is detected at these outermost pointings.
Current usage metrics show cumulative count of Article Views (full-text article views including HTML views, PDF and ePub downloads, according to the available data) and Abstracts Views on Vision4Press platform.
Data correspond to usage on the plateform after 2015. The current usage metrics is available 48-96 hours after online publication and is updated daily on week days.
Initial download of the metrics may take a while.