Fig. 1
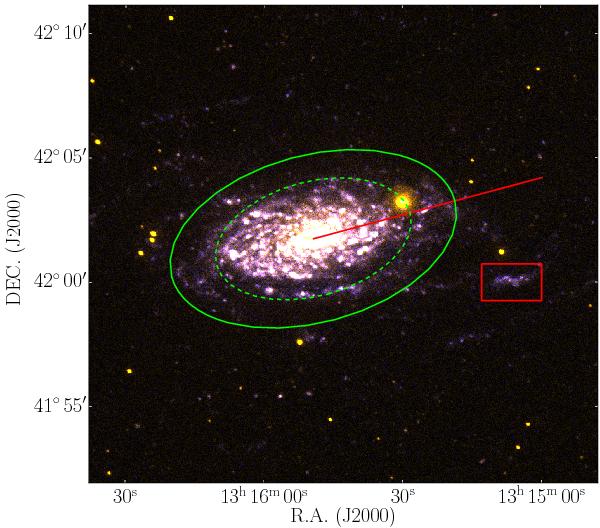
False three-color (red/green/blue) composite image of M 63 from Gil de Paz et al. (2007). The image was produced using the arcsinh function, which allows showing faint structures while simultaneously preserving brighter structures in the field, such as the spiral arms of large galaxies (Lupton et al. 2004). The green ellipse represents the B-band 25 mag arcsec-2 isophote limit, r25. The red solid line shows the CO mapping we performed along the major axis of M 63 from the center out to rgal = 572″ = 1.6 r25, where 27 single pointings were aligned with a spatial sampling of 22″. The red box encloses the bright UV region at rgal = 483″ = 1.36 r25 which we mapped with 6 × 2 = 12 pointings with the same spatial sampling. The CO(1–0) emission is observed out to the isophotal radius along the radial cut and in the bright UV region, while the CO(2–1) emission is confined to 0.68 r25 (dashed green ellipse).
Current usage metrics show cumulative count of Article Views (full-text article views including HTML views, PDF and ePub downloads, according to the available data) and Abstracts Views on Vision4Press platform.
Data correspond to usage on the plateform after 2015. The current usage metrics is available 48-96 hours after online publication and is updated daily on week days.
Initial download of the metrics may take a while.