Fig. 6
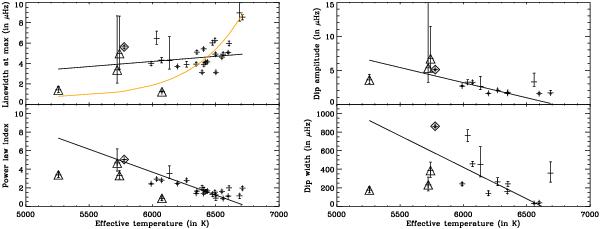
Parameters of Eq. (1) as a function of the effective temperature for all 28 stars, for the power law dependence (left) and for the Lorentzian fit (right). The median value together with the credible intervals at 33% and 66% were derived from a Monte-Carlo simulation of the fit. The orange line shows the temperature dependence of the linewidth at the frequency of maximum mode height as derived by Appourchaux et al. (2012a). The open diamond is the result of the fit for the solar data of the LOI. The open triangles are the results of the fit for the sub-giant stars of Benomar et al. (2013). The solid lines show a linear fit of the parameters with respect to the effective temperature. The Lorentzian parameters for stars for which the Lorentzian fit is not significant are not plotted.
Current usage metrics show cumulative count of Article Views (full-text article views including HTML views, PDF and ePub downloads, according to the available data) and Abstracts Views on Vision4Press platform.
Data correspond to usage on the plateform after 2015. The current usage metrics is available 48-96 hours after online publication and is updated daily on week days.
Initial download of the metrics may take a while.