Fig. 4
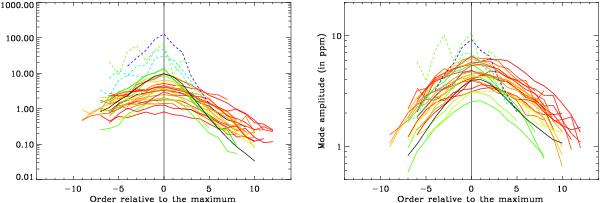
Mode height and amplitude as a function of the mode order for the 23 stars with their colour identified by their effective temperature (as in Fig. 3), for the 4 sub-giant stars of Benomar et al. (2013) (dashed lines), and for the solar LOI data (solid black line). The relative 1-σ error bars for mode height are similar to those of the mode linewidth, while they are typically 3 times smaller for mode amplitude.
Current usage metrics show cumulative count of Article Views (full-text article views including HTML views, PDF and ePub downloads, according to the available data) and Abstracts Views on Vision4Press platform.
Data correspond to usage on the plateform after 2015. The current usage metrics is available 48-96 hours after online publication and is updated daily on week days.
Initial download of the metrics may take a while.