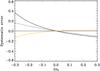
Fig. A.5
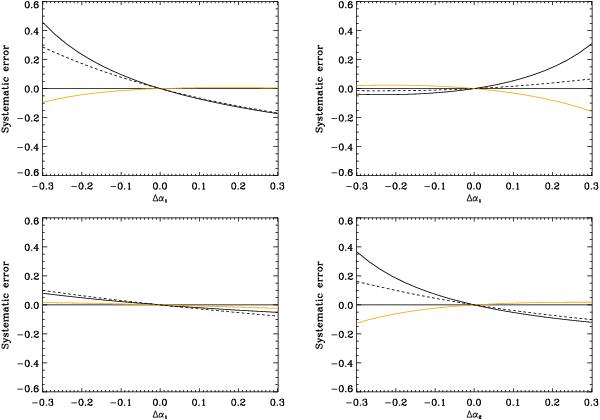
Relative systematic error as a function of the deviation to the reference mode visibility for the mode height (black line) and linewidth (orange line) for a set of l = 0,1,2 modes with a 2-μHz linewidth, and a signal-to-noise ratio 10 for the l = 0 mode. The continuous lines are the systematic error computed using the method of Toutain et al. (2005). The dashed line is the analytical systematic error on mode height derived assuming there is no systematic error on the linewidth derived from Eq. (B.38). Top left: the deviations to the reference mode visibilities are identical for l = 1 and l = 2. Bottom left: the deviations to the reference mode visibilities are of opposite sign for l = 1 and l = 2. Top right: the deviation to the reference mode visibilities is zero for l = 2. Bottom right: the deviation to the reference mode visibilities is zero for l = 1.
Current usage metrics show cumulative count of Article Views (full-text article views including HTML views, PDF and ePub downloads, according to the available data) and Abstracts Views on Vision4Press platform.
Data correspond to usage on the plateform after 2015. The current usage metrics is available 48-96 hours after online publication and is updated daily on week days.
Initial download of the metrics may take a while.