Fig. 9
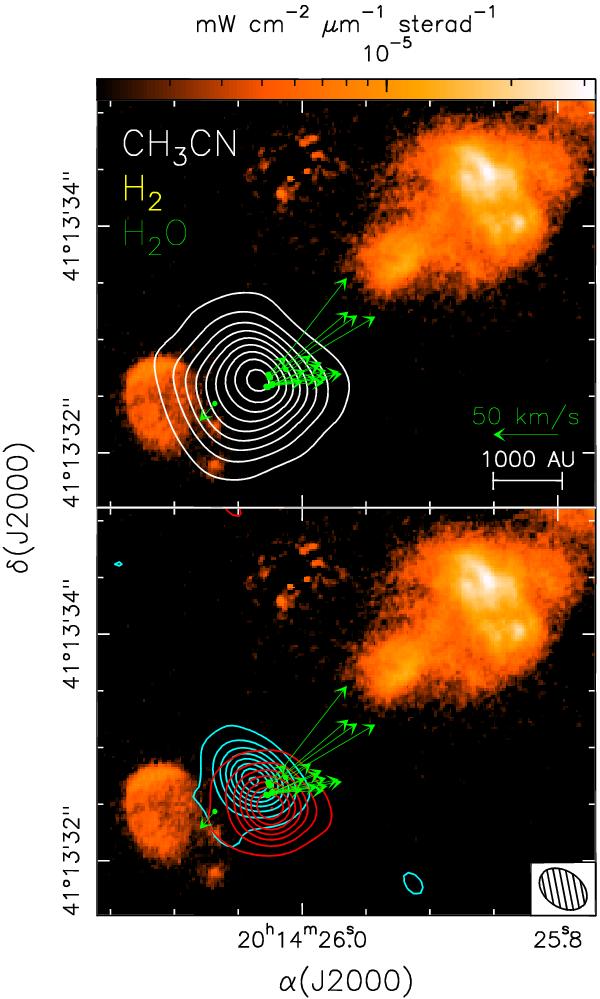
Overlay of the bulk (top panel) and blue- and red-shifted emission (bottom panel) of the CH3CN K = 3 line on the image of the H2 2.2 μm line emission obtained by C2013. The green points and arrows denote the H2O maser spots and associated proper motions measured by Moscadelli et al. (2005). Contour levels in the top panel are the same as in Fig. 4, while in the bottom panel range from 15 to 225 in steps of 30 mJy/beam.
Current usage metrics show cumulative count of Article Views (full-text article views including HTML views, PDF and ePub downloads, according to the available data) and Abstracts Views on Vision4Press platform.
Data correspond to usage on the plateform after 2015. The current usage metrics is available 48-96 hours after online publication and is updated daily on week days.
Initial download of the metrics may take a while.