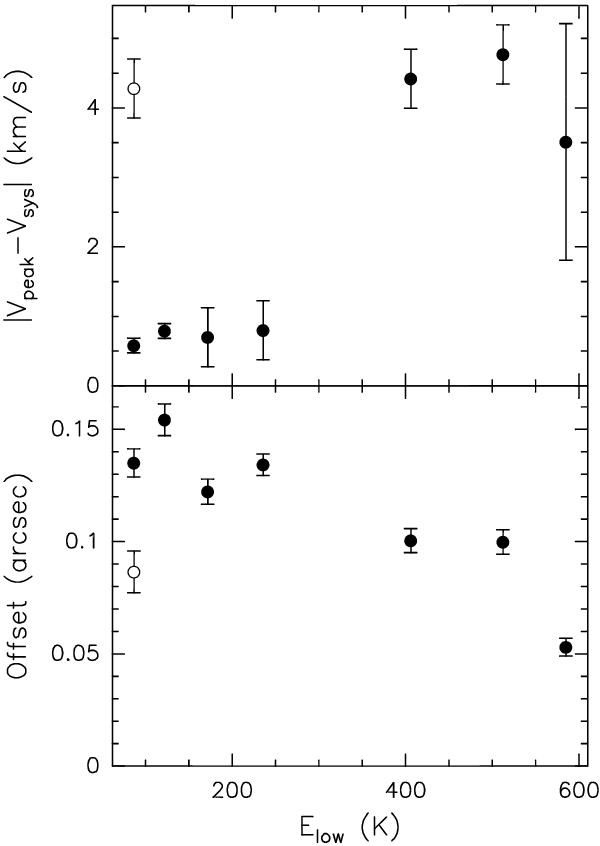
Fig. 7

Plots of the peak positions in the PV plots in Fig. 6 versus the energy of the lower level of the corresponding transition. The black points correspond, from left to right, to the K = 2,3,4,5,7,8 and v8 = 1 K,l = 1,1 lines, while the white point denotes the CH313CN K = 2 line. Top: absolute value of the relative velocity of the peak with respect to the systemic velocity, Vsys ≃ −3.9 km s-1. The bars correspond to half the velocity channel. Bottom: absolute value of the distance of the peak from the position of the continuum peak, measured along the plane of the disk (i.e. along the direction with PA = +37°).
Current usage metrics show cumulative count of Article Views (full-text article views including HTML views, PDF and ePub downloads, according to the available data) and Abstracts Views on Vision4Press platform.
Data correspond to usage on the plateform after 2015. The current usage metrics is available 48-96 hours after online publication and is updated daily on week days.
Initial download of the metrics may take a while.


