Fig. 6
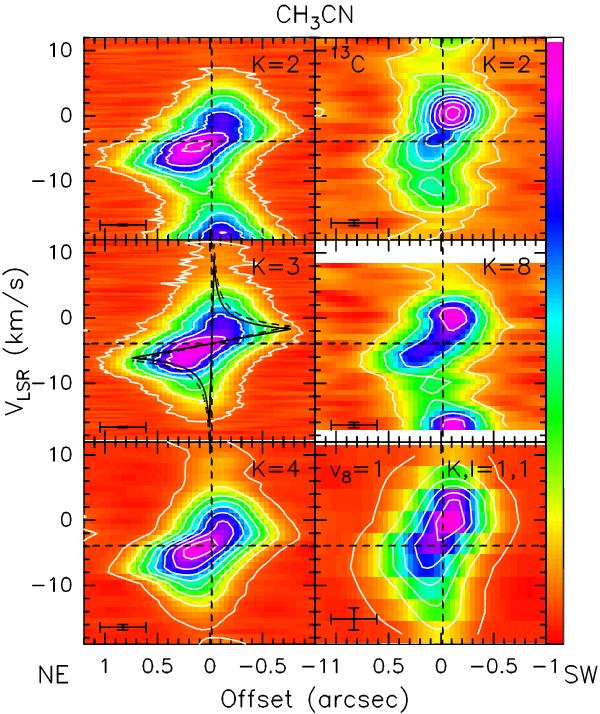
Position–velocity plots along a direction with PA = +37° passing through the continuum peak. The crosses in the bottom left corners denote the spatial and spectral resolutions. Contour levels (in units of brightness temperature in the synthesized beam) range: from 4 to 82 in steps of 13 K (1σ RMS ≃ 1.2 K) for the K = 2 line; from 4 to 74 in steps of 14 K (1σ RMS ≃ 1.2 K) for the K = 3; from 3 to 66 in steps of 9 K (1σ RMS ≃ 0.67 K) for the K = 4; from 2 to 26 in steps of 3 K (1σ RMS ≃ 0.42 K) for the K = 2 line of CH313CN; from 1 to 10 in steps of 3 K (1σ RMS ≃ 0.61 K) for the K = 8; and from 1 to 26 in steps of 5 K (1σ RMS ≃ 0.24 K) for the K,l = 1,1 line. The dashed horizontal and vertical lines correspond to the systemic velocity and position of the 1.4 mm continuum peak. The “butterfly-shaped” patterns in the K = 3 panel outline the regions inside which emission is expected if the gas lies in a disk with radius of 0.̋75 (~1200 AU), rotating about a 7 M⊙ star (solid pattern) and a 10 M⊙ star (dashed).
Current usage metrics show cumulative count of Article Views (full-text article views including HTML views, PDF and ePub downloads, according to the available data) and Abstracts Views on Vision4Press platform.
Data correspond to usage on the plateform after 2015. The current usage metrics is available 48-96 hours after online publication and is updated daily on week days.
Initial download of the metrics may take a while.