Fig. 5
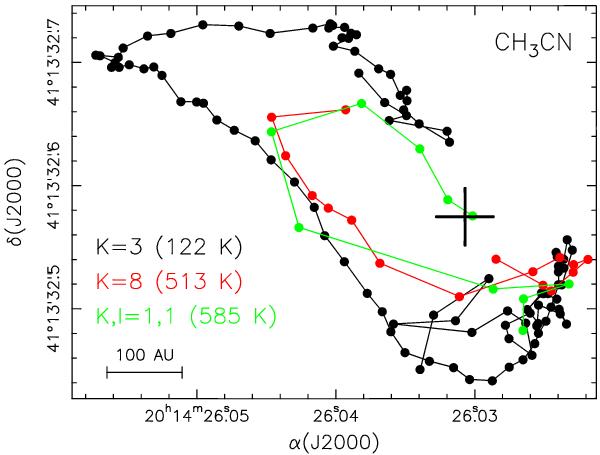
Distributions of the CH3CN emission peaks at different velocities, obtained with a 2D Gaussian fit to the channel maps of the K = 3 (black points), K = 8 (red), and K,l = 1,1 (green) lines. The cross marks the position of the continuum peak, which we believe to be a good approximation for the location of the protostar. We note how the higher excitation lines trace a region closer to the protostar.
Current usage metrics show cumulative count of Article Views (full-text article views including HTML views, PDF and ePub downloads, according to the available data) and Abstracts Views on Vision4Press platform.
Data correspond to usage on the plateform after 2015. The current usage metrics is available 48-96 hours after online publication and is updated daily on week days.
Initial download of the metrics may take a while.