Fig. 4
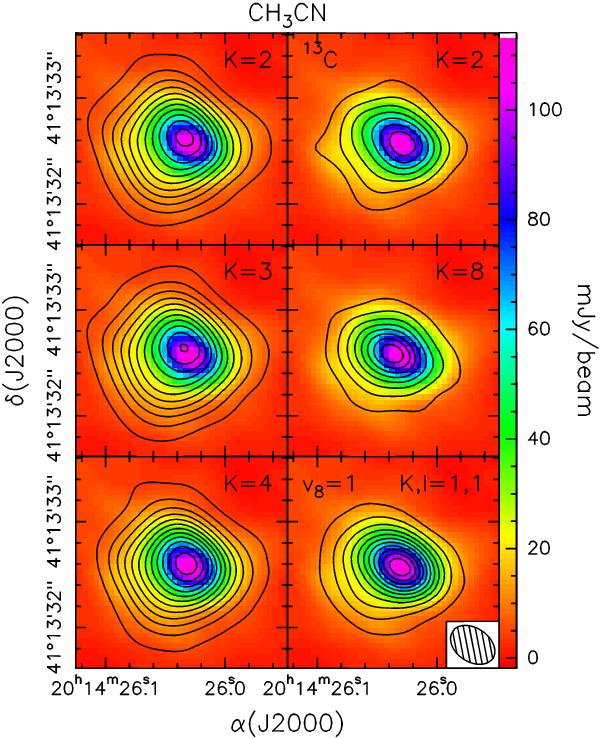
Contour maps of the bulk emission in the same lines as in Fig. 3, obtained by averaging the emission over the velocity interval delimited by the dotted lines in Fig. 3. The background image is the continuum emission shown also in Fig. 1. Contour levels range: from 21.6 to 381.6 in steps of 36 mJy/beam (1σ RMS ≃ 7 mJy/beam) for the K = 2 line; from 22.8 to 402.8 in steps of 38 mJy/beam (1σ RMS ≃ 8 mJy/beam) for the K = 3; from 16.8 to 324.8 in steps of 28 mJy/beam (1σ RMS ≃ 6 mJy/beam) for the K = 4; from 4.5 to 49.5 in steps of 7.5 mJy/beam (1σ RMS ≃ 1.5 mJy/beam) for the K = 2 line of CH313CN; from 8.7 to 95.7 in steps of 14.5 mJy/beam (1σ RMS ≃ 3 mJy/beam) for the K = 8; and from 8.7 to 153.7 in steps of 14.5 mJy/beam (1σ RMS ≃ 3 mJy/beam) for the K,l = 1,1 line.
Current usage metrics show cumulative count of Article Views (full-text article views including HTML views, PDF and ePub downloads, according to the available data) and Abstracts Views on Vision4Press platform.
Data correspond to usage on the plateform after 2015. The current usage metrics is available 48-96 hours after online publication and is updated daily on week days.
Initial download of the metrics may take a while.