Fig. 2
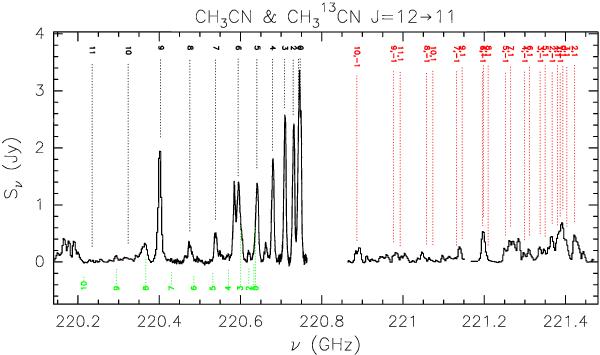
Methyl cyanide spectrum obtained with the Plateau de Bure interferometer towards IRAS 20126+4104. The line emission has been integrated over the core. The dotted lines mark the CH3CN (from top) and CH313CN (from bottom) transitions. The single numbers denote the K component, while the number pairs correspond to the K,l quantum numbers of the vibrationally excited, v8 = 1, transitions. We note how most of the CH3CN and CH313CN components are blended with other methyl cyanide lines and/or with lines of other species.
Current usage metrics show cumulative count of Article Views (full-text article views including HTML views, PDF and ePub downloads, according to the available data) and Abstracts Views on Vision4Press platform.
Data correspond to usage on the plateform after 2015. The current usage metrics is available 48-96 hours after online publication and is updated daily on week days.
Initial download of the metrics may take a while.