Fig. 10
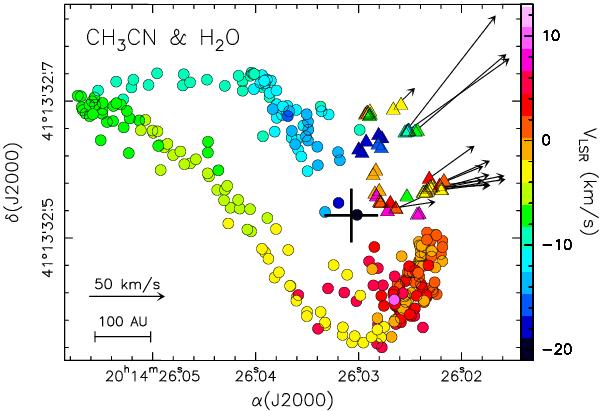
Map of the peaks of the CH3CN K = 2,3,4 line emission (circles) and water maser spots (triangles) from Moscadelli et al. (2000; 2005) and Edris et al. (2005). The colour indicates the LSR velocity according to the code reported in the scale to the right. The arrows indicate the proper motions measured by Moscadelli et al. (2005). The cross marks the position of the continuum emission peak.
Current usage metrics show cumulative count of Article Views (full-text article views including HTML views, PDF and ePub downloads, according to the available data) and Abstracts Views on Vision4Press platform.
Data correspond to usage on the plateform after 2015. The current usage metrics is available 48-96 hours after online publication and is updated daily on week days.
Initial download of the metrics may take a while.