| Issue |
A&A
Volume 566, June 2014
|
|
|---|---|---|
| Article Number | A78 | |
| Number of page(s) | 10 | |
| Section | Interstellar and circumstellar matter | |
| DOI | https://doi.org/10.1051/0004-6361/201322941 | |
| Published online | 17 June 2014 | |
Herschel spectral mapping of the Helix nebula (NGC 7293) ⋆,⋆⋆
Extended CO photodissociation and OH+ emission
1 Departamento de Astrofísica, Centro de Astrobiología, CSIC-INTA, Torrejón de Ardoz 28850 Madrid Spain
e-mail: This email address is being protected from spambots. You need JavaScript enabled to view it.
2 Grupo de Astrofísica Molecular, Instituto de Ciencias de Materiales de Madrid, CSIC-ICMM Cantoblanco, 28049 Madrid, Spain
3 Royal Observatory of Belgium, Ringlaan 3, 1180 Brussels, Belgium
4 Department of Physics & Astronomy, University College London, London WC1E 6BT, UK
5 RAL Space, Rutherford Appleton Laboratory, Oxfordshire, OX11 0QX, UK
6 University of Vienna, Department of Astrophysics, Türkenschanzstraße 17, 1180 Wien, Austria
7 LOMC-UMR 6294, CNRS-Université du Havre, 25 rue Philippe Lebon, BP 540, 76058 Le Havre, France
8 Department of Physics and Astronomy, The Open University, Milton Keynes, MK7 6AA, UK
9 Institute for Space Imaging Science, Dept. of Physics & Astronomy, University of Lethbridge, Lethbridge, AB T1K3M4, Canada
10 Institute of Astrophysics, KU Leuven, Celestijnenlaan 200D, 3001 Leuven, Belgium
11 Department of Physics and Astronomy, University of Denver, 2112 E. Wesley Ave., Denver CO 80210, USA
12 Institute of Space and Astronautical Science, Japan Aerospace Exploration Agency, 3-1-1 Yosinodai, Chuo-ku, 252-5210 Sagamihara, Kanagawa, Japan
Received: 29 October 2013
Accepted: 28 March 2014
Abstract
Context. The Helix nebula (NGC 7293) is our closest planetary nebulae. Therefore, it is an ideal template for photochemical studies at small spatial scales in planetary nebulae.
Aims. We aim to study the spatial distribution of the atomic and the molecular gas, and the structure of the photodissociation region along the western rims of the Helix nebula as seen in the submillimeter range with Herschel.
Methods. We used five SPIRE FTS pointing observations to make atomic and molecular spectral maps. We analyzed the molecular gas by modeling the CO rotational lines using a non-local thermodynamic equilibrium (non-LTE) radiative transfer model.
Results. For the first time, we have detected extended OH+ emission in a planetary nebula. The spectra towards the Helix nebula also show CO emission lines (from J = 4 to 8), [N ii] at 1461 GHz from ionized gas, and [C i] (3P2–3P1), which together with the OH+ lines trace extended CO photodissociation regions along the rims. The estimated OH+ column density is ~ 1012 − 1013 cm-2. The CH+ (1–0) line was not detected at the sensitivity of our observations. Non-LTE models of the CO excitation were used to constrain the average gas density (n(H2) ~ (1 − 5) × 105 cm-3) and the gas temperature (Tk ~ 20−40 K).
Conclusions. The SPIRE spectral-maps suggest that CO arises from dense and shielded clumps in the western rims of the Helix nebula, whereas OH+ and [C i] lines trace the diffuse gas and the UV and X-ray illuminated clump surfaces where molecules reform after CO photodissociation. The [N ii] line traces a more diffuse ionized gas component in the interclump medium.
Key words: planetary nebulae: individual: NGC 7293 / infrared: ISM / photon-dominated region (PDR) / ISM: molecules / ISM: lines and bands
Herschel is an ESA space observatory with science instruments provided by European-led Principal Investigator consortia and with important participation from NASA.
The reduced images as FITS files are only available at the CDS via anonymous ftp to cdsarc.u-strasbg.fr (130.79.128.5) or via http://cdsarc.u-strasbg.fr/viz-bin/qcat?J/A+A/566/A78
© ESO, 2014
1. Introduction
Planetary nebulae (PNe) represent the final stage in the evolution of low- and intermediate-mass stars like the Sun. These stars lose matter during the asymptotic giant branch (AGB) phase, and form an expanding circumstellar envelope. While the central stars evolve from the AGB phase to the planetary nebula (PN) phase, the effective temperatures of the stars rise, increasing the UV radiation. Molecules previously ejected in mass loss episodes from the progenitor star are photodissociated by the UV photons as the dissociation front advances through the gas. When the central star becomes hotter than ~ 30 000 K, the circumstellar gas is ionized. The nebular gas cools radiatively, i.e., by visible line emission. However, the entire envelope is not ionized and neutral atoms and molecules dominate the gas cooling in photodissociation regions (PDRs) and in the shielded gas. In PNe, the neutral and molecular material form fragmented rims around the ionized nebula. Their infrared spectrum is characterized by [C i], [O i], [C ii] atomic fine structure lines, and rotational lines of CO and H2.
The Helix nebula (NGC 7293) is the closest PN at a distance of 219 ± 30 pc (Harris et al. 2007), therefore it is a unique template for resolving the different structures expected in a planetary nebula (i.e., H ii region, PDRs, and shielded molecular gas). The central star of the Helix nebula is a white dwarf with an effective temperature of Teff ~ 120 000 K, a luminosity of L ~ 76 L⊙, and a mass of M ~ 0.57M⊙ (Napiwotzki 1999; Traulsen et al. 2005). The central star is a source of X-rays at energies ~ 0.25 keV that arise from the stellar photosphere. In addition, Chandra and ROSAT observations revealed X-ray emission near ~ 1 keV (Leahy et al. 1994; Guerrero et al. 2001). Its origin remains uncertain.
Observational parameters.
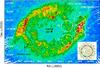 |
Fig. 1 Footprint of the five SPIRE FTS observations over the SPIRE 250 μm photometric image. White circles show the layout of the unvignetted field of view (FoV ~ 2.0 arcmin in diameter) of the four Must-Do observations, and the white-dashed circle shows the FoV of the pvanhoof observation. The total area coverage by the five observations is ~6 × 8 arcmin2. Layout of the FTS detector arrays (SLW in green and SSW in red) and the FoV (black) is shown in the lower-right corner. The circle sizes of the detectors correspond to the FWHM of the beam. Black contours trace levels: 10, 12.5, 15, 17.5, and 20 MJy sr-1. |
Low-Js CO and H2 observations of the Helix nebula show dense, neutral knots with ionized cometary tails located in the central region of the nebula (Huggins et al. 2002; O’Dell et al. 2005; Hora et al. 2006; Matsuura et al. 2007). Matsuura et al. (2009) showed that it is in the inner region of the Helix, towards the central star, where tails are observed from the neutral globules probably created by the stellar winds from the central star (Meaburn & Boumis 2010; Matsuura et al. 2009; Speck et al. 2002). The ionized cavity is surrounded by a double rim of dust, and molecular and atomic gas (see Fig. 1). The inner rim is a circular and fragmented ring around the central star (Young et al. 1999) with an inner radius ~ 175″ (~ 0.2 pc). The outer rim has an inner radius of ~ 340″ (~ 0.35 pc). Knots at the envelope are difficult to resolve and seem to form clumps. The clumpiness and the strong UV fields in the envelope determine much of the physical and chemical conditions.
The Helix is probably an oxygen-rich planetary nebula (C/O = 0.87 ± 0.12; Henry et al. (1999), with a high abundance of neutral carbon, N[C i]/N(CO) ~ 6 measured towards the outer western rim (Cox et al. 1998). The Helix molecular envelope is devoid of PAHs, which is consistent with its C/O ratio (Hora et al. 2006).
So far, the lower energy levels of OH+ emission lines have been detected in the ultra-luminous galaxies Mrk 31 (van der Werf et al. 2010) and NGC 1068 (Spinoglio et al. 2012). Most recently, Van der Tak et al. (2013) presented the first detection of extended OH+ line emission in the galaxy, toward the Orion Bar, using the HIFI instrument onboard Herschel.
In this paper, we report the first detection of extended OH+ emission in a circumstellar envelope, a essential ion precursor for oxygen chemistry. Simultaneously with this detection, Aleman et al. (2013) detected OH+ emission in three planetary nebulae, NGC 6445, NGC 6720, and NGC 6781, obtained from the Herschel Planetary Nebulae Survey (HerPlaNS; Ueta et al. 2012). Their work is also published in this volume. We also detected OH+ in emission in NGC 6853 planetary nebula. This nebula was also observed as part of the OT2 project (PI: van Hoof). The Helix nebula and NGC 6853 present very similar features in the SPIRE FTS spectra, showing emission lines of [N ii], CO rotational lines (from J = 4–3 to J = 8–7), [C i], and OH+ along the molecular rims. A detailed analysis of the NGC 6853 nebula will be presented in a forthcoming paper.
In this work, we study the physical and chemical conditions in the western rims of the Helix nebula by analyzing the submm spectra from 447 GHz to 1550 GHz taken with the Herschel SPIRE Fourier Transform Spectrometer (FTS). The SPIRE FTS spectral maps allow us to study the molecular gas by modeling the CO rotational line emission and to study the distribution of the atomic and the molecular gas along the western rims.
2. Observation and data reduction
The SPIRE FTS instrument (Griffin et al. 2010), on board the Herschel Space Observatory (Pilbratt et al. 2010), observed the Helix nebula with two detector arrays, the SPIRE Short Wavelength (SSW) Spectrometer with 37 detectors covering the frequency range 958–1546 GHz and the SPIRE Long Wavelength (SLW) Spectrometer with 19 detectors covering the range 447–990 GHz, with a pixel spacing of approximately twice the beam. Four sparse single pointing observations were made at a spectral resolution of 0.04 cm-1 (1.2 GHz, equivalent to 300–940 km s-1) in bright mode through a Must-Do program with a total integration time of 3612 s for each observation. An additional single pointing observation was made through an Open Time 2 (OT2) project (PI: van Hoof) with a total integration time of 6992 s (see Table 1 for details).
Figure 1 shows the layout of each pointing observation superimposed on the SPIRE 250 μm photometric image. The observations cover a total area of ~ 6 × 8 arcmin2 tracing the inner and the outer rims at the western side of the Helix nebula.
The SPIRE FTS data were reduced with the Herschel interactive processing environment (HIPE) version 11.1.0 (Ott et al. 2010). The full width half maximum (FWHM) of the SPIRE FTS beam is wavelength dependent, changing between 17′′ and 21′′ for the SSW band and between 29′′ to 42′′ for the SLW band (Makiwa et al. 2013).
The SPIRE 250 μm fully sampled image was processed with HIPE using standard version 10.0 build 2744. In addition to the standard processing, the data were zero-point corrected using the Planck dust model. The image is made with FWHM = 18.5′′, in MJy/sr, and at 6′′/pixel. The SPIRE images will be discussed further in a forthcoming paper by Van de Steene et al. (in prep.).
We also analyze the H2 distribution and its spatial correlation with the atomic and the molecular gas through the western rims of the Helix nebula using a H2 2.122 μm image from Speck et al. (2002). The Helix was observed with the Near-Infrared Imager (NIRIM; Meixner et al. 1999) at the Mount Laguna 1 m telescope with the 2′′/pixel scale (see Speck et al. 2002 for the calibration details).
2.1. Spectral-maps with the SPIRE FTS
The five SPIRE FTS observations provide sparse spatial sampling of the molecular and ionized gas across the western rims of the Helix nebula. The integrated line intensities were obtained from the unapodized SPIRE FTS spectra after the subtraction of the continuum. To get good accuracy on the central frequencies of spectral lines, the frequency scale was converted to the LSR frame, taking into account the radial velocity (vrad) of the Herschel telescope along the line of sight, so that the corrected central frequency was calculated as νcorr. = ν(1 − vrad/c). The line shape was fitted with a classical sinc function using the line-fitting tool available in HIPE. Sparsely sampled maps (Fig. 3) for several emission lines were made by interpolating the value of the integrated intensity of each line measured by adjacent detectors to halfway positions in order to analyze the spatial distribution of these species. The maps of those lines observed with the SLW detector have an angular resolution FWHM ~ 30–35′′ and maps of the lines in the frequency range of the SSW detector are spatially better sampled with an angular resolution FWHM similar to 18′′. The total area covered by the five observations is ~ 6 × 8 arcmin2, and the resulting maps are centered at the position RA(J2000) = 22h29m16.3s, Dec(J2000) = −20°50′25.96′′. The area was covered at 95 individual positions with detectors in the SLW array, and 185 positions with detectors in the SSW array. The maps were made with the same pixel size as the SPIRE 250 μm image, 6′′/pixel.
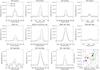 |
Fig. 2 Line profiles of the atomic and molecular lines observed with SPIRE-FTS in the western rims of the Helix nebula. To reduce the sidelobes, the spectra were apodized with an extended Norton-Beer function (FWHM = 15′′) to a resolution of 0.072 cm-1. Bottom right: the spectral lines are observed at four positions along the western rims, two positions in the inner rim (B in red, C in blue), and two positions in the outer rim (A in black, D in green). |
3. Results
Figure 2 shows the spectral lines detected at four different positions, two in the inner western rim and the other two in the outer western rim. The spectra show CO rotational lines in emission from J = 4–3 to J = 8–7 transitions, and rotational lines in emission from the lowest energy levels of OH+ at 909.1 GHz, 971.9 GHz, and 1033 GHz. The detection of extended OH+ lines in emission is particularly interesting. The OH+ critical densities for collisional excitation are high, ncr> 106 cm-3, therefore, most of the OH+ detections to date have been observed in absorption against the strong submm background continuum emission (i.e., toward the Sgr B2 molecular cloud, toward Sgr A∗, in the Orion BN/KL outflow, and toward several low- and high-mass star forming regions; Gerin et al. (2010); Neufeld et al. (2010); Wyrowski et al. (2010); Gupta et al. (2010); Etxaluze et al. (2013); Goicoechea et al. (2013).
The spectra also show the fine structure emission lines of [C i] ( –
– ) at 492.39 GHz; [C i] (
 –) at 809.34 GHz, which is blended with the CO J = 7–6 line at 806.65 GHz; and [N ii] (–) at 1461 GHz. Most lines are brighter at the two positions observed in the outer western rim, except [N ii], which seems equally bright in the inner and in the outer rims. The [N ii] line is the brightest in the SPIRE-FTS spectra. The spectra also show a weak emission line from the ground-state ortho-H2O at 557.3 GHz.
Table 2 summarizes the line surface brightness of all the observed lines between 430 GHz and 1550 GHz, obtained from the SPIRE FTS unapodized spectra at four different positions toward western rims. The Helix nebula presents a very complex velocity structure when observed at much higher spectral resolution. Zack & Ziurys (2013) observed CO rotational lines (from J = 1–0 to J = 3–2) toward the Helix with a line spectral resolution ~ 0.9–1.3 km s-1, revealing multiple velocity components in the three CO transitions. The observed velocities are in the range ~−(11 − 30) km s-1 toward the western rims. The CO rotational lines (J ≥ 4) observed with the SPIRE FTS may consist of several blended velocity components unresolved due to the lower resolution (≥300 km s-1), preventing a detailed analysis of the complex kinetic structure of the Helix nebula.
3.1. Spatial distribution of [N ii], C, CO, and OH+
Figure 3 shows the integrated line intensity sparsely sampled maps of [N ii] ( ) at 1461 GHz, along with the CO J = 5–4 rotational line, OH+ (N = 1–0) at 971.9 GHz, and [C i] (
 ) at 809.34 GHz, and their contours superimposed on the SPIRE 250 μm image. Among the detected CO rotational lines, the J = 5–4 line is the brightest along the molecular rims. This line was chosen to trace the CO distribution along the western rims. The comparison of these maps allows us to study the excitation mechanisms of the emission lines and the distribution of the different species through the region. The maps cover a total area of ~ 6 × 8 arcmin2, corresponding to ~ 0.4 × 0.5 pc2 for a distance of 219 pc (Harris et al. 2007).
Figure 3a shows the distribution of the [N ii] () surface brightness along the western edge of the Helix nebula, and Fig. 3b shows a contour plot of the [N ii] intensity distribution superimposed on the SPIRE photometric image at 250 μm. The 250 μm image traces the distribution of cold dust through the Helix nebula. The SPIRE 250 μm image (Figs. 3b, d and f) shows cold dust distributed through the inner and the outer western rims with a bright structure of cold dust in the outer western rim. The [N ii] line traces gas ionized by radiation from the central star, which is located at a distance of ~ 241 arcsec (~ 0.25 pc) to the east of the inner western rim. The [N ii] line traces the position of the two rims. The inner western rim observed in the [N ii] map matches the position of the inner western rim traced by the cold dust on the SPIRE 250 μm image. In the outer western rim, the [N ii] emission extends along the face pointing toward the central star, along the inner side of the outer western rim.
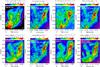 |
Fig. 3 a), c), and e) surface brightness maps of [N ii] at 1461 GHz, CO (J = 5–4), and OH+ at 971.8 GHz, respectively. The contours of these maps are overlaid on the SPIRE 250 μm image: b), d), and f), respectively. g) shows the image of the surface brightness of [C i] (2–1), and h) shows the contours of the [C i] (2–1) intensity distribution overplotted on the OH+ 971.8 GHz map. All the maps are centered at RA(J2000) = 22h29m16.3s, Dec(J2000) = −20°50′25.96′′. The maps are resampled with a scale of 6′′/pixel. |
Figures 3c and 3d show the distribution of the CO J = 5–4 emission line throughout the Helix, and the CO J = 5–4 surface brightness contours overlaid on the SPIRE 250 μm image, respectively. The CO J = 5–4 line is mainly distributed along the outer western rim tracing the dust emission at 250 μm. The CO emission peak is coincident with the strongest dust continuum emission in Fig. 3d. The inner western rim is less evident.
The OH+ 971.8 GHz and [C i] () 809.34 GHz surface brightness distributions (Figs. 3 e and g, respectively) trace the inner and the outer western rims on the SPIRE 250 μm image (Fig. 3f), with the outer rim being brighter than the inner. The OH+ and [C i] distributions are spatially coincident peaking at the same position in the outer western rim (Fig. 3 h). The OH+ and [C i] emission lines are brighter than the CO J = 5–4 line and their brightness distributions extend to the west of the outer rim, while the CO J = 5–4 line emission distribution is delimited along the center of the rim.
Figure 4 shows two spectra, each made by co-adding the spectra measured by three SLW detectors at three different positions. By co-adding the spectra, we achieve a better signal-to-noise ratio to identify the intrinsically weak atomic and the molecular emission lines in the region. The lower spectrum of Fig. 4 is a result of co-adding the signal from detectors SLWC2, SLWC3, and SLWC4 (see Fig. 5a), which cover the emission along the outer western rim. Detectors SLWD2, SLWD3, and SLWD4 (Fig. 5a) cover the gas emission at the west side of the outer western rim and their signals were also co-added (Fig. 4 top). The final co-added spectra show strong emission lines of OH+ at 909.3 GHz and 971.8 GHz, and [C i] at 492.16 GHz and 809.34 GHz, together with CO rotational lines from J = 4–3 to J = 7–6 along the outer western rim. The CO rotational lines are below the detection limit along the west side of the outer western rim, and only the OH+ and the [C i] lines are bright enough to be detected.
3.2. CO rotational ladder
We plotted the CO rotational population diagrams using the CO lines from J = 4–3 to J = 8–7 at seven different positions through the outer western rim (Figs. 5a and b). For detailed analysis, we used target T5 as the integration time is longest and the quality of its spectrum is the best. The other four observations were not used as they had lower integration times, with consequently poorer signal-to-noise ratios, and only three CO lines were detected at each position. The CO rotational diagrams provide the rotational temperature, Trot. Assuming extended and optically thin emission, Trot is a lower limit to the gas kinetic temperature, Tk. We can also derive the beam-averaged CO column density, N(CO).
Figure 5b shows the CO rotational diagrams at seven different positions throughout the outer western rim. The rotational diagrams are best fitted with a single excitation temperature component. The rotational temperatures are relatively low, over the range ~20–30 K. The rotational temperature along the outer rim is ~30 K, from north to south. The temperatures are lower on the west side of the outer western rim. The CO column densities are in the range ~(7–12) × 1014 cm-2 with the highest values distributed along the center of the outer western rim. The values are in good agreement with those found by Zack & Ziurys (2013) from lower-J CO observations at the position of the western rims who determined N(CO) values of ~7 × 1014 cm-2 and ~14 × 1014 cm-2, for two different velocities components at –11 km s-1 and –21 km s-1, respectively. The values of the rotational temperature and the CO column density at each position are indicated in Table 3.
3.3. Modeling the CO rotational ladder
Observations of CN, CO, and HCO+ of the Helix nebula by Bachiller et al. (1997) show relatively high gas densities, n(H2) ~ (1 − 4) × 105 cm-3. This density is below or comparable to the critical densities for collisional excitation of the observed CO lines. Therefore, we assume the CO excitation to be in a regime where Trot ≲ Tk. In order to constrain the physical conditions that reproduce the observed CO intensities towards the outer western rim, we treated the non-LTE excitation and radiative transfer problem with MADEX, an LVG (large velocity gradient) code (Cernicharo 2012). As a first approximation, the CO column density is assumed to be similar to that determined from the CO rotational diagrams. Thus, we searched for a combination of the kinetic temperature, Tk, and the molecular hydrogen density, n(H2), that most accurately reproduces the observed CO intensities from J = 4–3 to J = 8–7 (Fig. 5c). A line width of Δv = 8 km s-1 was adopted, similar to that measured on the CO J = 3–2 line by Zack & Ziurys (2013). The best fit is obtained for kinetic temperatures Tk ~ 20–40 K across the Helix, with Tk ~ 40 K in the inner side of the outer rim and decreasing outwards. The gas density is n(H2) ~ (1 − 6) × 105 cm-3. These results agree with previous studies, such as those obtained by Bachiller et al. (1997). Gas densities in the Helix were estimated to be n(H2) ~ 104 − 105 cm-3 based on observed transitions of H2 (Meixner et al. 2005). Zack & Ziurys (2013) estimated gas kinetic temperatures Tk ~ 15 − 40 K and general densities n(H2) ~ (0.1 − 5) × 105 cm-3 in the Helix based on five lines of H2CO (JKa,Kc = 10,1 → 00,0, 21,2 → 11,1, 20,2 → 10,1, 21,1 → 11,0, and 30,3 → 20,2) and three CO rotational lines (J = 1–0, J = 2–1, and J = 3–2). However, the gas traced by the low-Js (J ≤ 3) at the position of the western rims by Zack & Ziurys (2013) is associated with a colder gas component, Tk ~ 15–20 K, of lower densities n(H2) ~ (0.3 − 1.4) × 105 cm-3.
The average fractional abundance of CO relative to molecular hydrogen in the Helix is χ(CO) ~ 2.2 × 10⁻⁴ (Zack & Ziurys 2013); therefore, the molecular hydrogen column density traced by the mid-J CO lines is in the range N(H2) ~ (2 − 6) × 1018 cm-2.
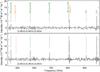 |
Fig. 4 Bottom: co-added SPIRE FTS spectra of three SLW detectors covering the center of the outer western rim. Top: co-added SPIRE FTS spectra of three SLW detectors covering the west side of the outer western rim. |
Trot (K), N(CO) (cm-2), and n(H2) (cm-3) throughout the outer western rim of the Helix nebula. Trot ~ Tk.
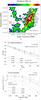 |
Fig. 5 a) Footprint of the SLW array (target T5) over the outer western rim. b) CO rotational diagrams showing the column density per statistical weight versus the energy of the upper level. The CO rotational diagrams are measured at seven different positions along the outer western rim (SLWC2, SLWC3, SLWC4, SLWC5, SLWB2, SLWD1, and SLWD3). c) Integrated CO intensities fitted with non-LTE models at the same seven positions previously mentioned. |
3.4. OH+ Local thermodynamic equilibrium analysis
The rates of collisional excitation of OH+ with H and H2 are unknown. The OH+ lines have high Einstein coefficients A10> 10-2 s-1, three orders of magnitude higher than those of the mid-J CO lines, and thus the critical densities of the OH+ (N = 1–0) are higher than the densities estimated by modeling the CO rotational ladder in non-LTE, along the molecular rings in the Helix. As a first approximation, the OH+ column density was estimated assuming a Boltzmann distribution of the rotational level population with an excitation temperature of Tex = 10–20 K. For Tex = 20 K, we estimated a column density of N(OH+) ~ 7 × 1011 cm-2 along the outer western rim, and then increased by a factor of ten for Tex = 10 K.
The estimated OH+ abundance relative to H2 is ~ 10-8 − 10-7. Similar OH+ abundances were inferred in the Orion Bar by Van der Tak et al. (2013) based on Meudon PDR models, assuming that most of the OH+ emission arises from the outermost UV illuminated layers of the PDR at extinctions AV< 0.4.
4. Discussion
We have presented the first detection of extended OH+ emission in a circumstellar envelope. The central star of the Helix nebula with a temperature Teff ~ 120 000 K (Napiwotzki 1999; Traulsen et al. 2005) is a strong source of ionizing UV radiation. Previous studies show the central region of the Helix (~ 0.25 pc in radius) dominated by highly ionized gas such as He ii (O’Dell 1998) and [O iv] (Leene & Pottasch 1987). Surrounding this highly ionized region, there are the inner and outer rims. Figure 1 presents the rims as a fragmented and clumpy structure traced by the dust continuum emission at 250 μm. The rims are subjected to the UV radiation from the central star, which enhances the rate of ionization in the clumps (Ali et al. 2001).
4.1. Ionic, atomic, and molecular spatial distribution
Figure 6a shows a composite image of [N ii] 1461 GHz (red), and the CO J = 5–4 rotational line (green), together with the H2 contours (white). The [N ii] line, with an ionization potential of 14.53 eV, traces the low-excitation ionized gas; [N ii] follows the molecular H2 emission along the inner western rim and the diffuse gas along the east side of the outer western rim that faces the central star. The [N ii] intensity drops drastically below the SPIRE FTS detection limit to the west from the center of the outer western rim. Matsuura et al. (2009) studied the Helix rims, using images in the 2.122 μm H2υ = 1 → 0S(1) line and [N ii] at 658.4 nm. They found that H2 is associated only with high-density clumps while [N ii] is distributed through the diffuse gas between them.
The CO J = 5–4 line emission is mainly located along the outer western rim. Throughout the outer rim, the CO column density is N(CO) ~ 12 × 1014 cm-2. The estimated molecular hydrogen density is n(H2) ~ 6 × 105 cm-3. The values of N(CO) and n(H2) decrease by approximately half to the west of the outer rim. Maps of high density tracers such as HCO+J = 1–0 (Zeigler et al. 2013) and CO J = 2–1 (Young et al. 1999) also present a clear intensity maximum in the outer rim. The map of the CO J = 2–1 line with a critical density ncr ~ 104 cm-3 shows a clumpy and fragmented inner western ring while the CO J = 5–4 line (ncr ~ 105 cm-3) is barely detected in the SPIRE FTS spectra along the inner western rim.
Figures 6b and c show the distribution of OH+ and [C i] ( –
– ), respectively, together with the CO J = 5–4 line and the H2 intensity contours. As presented in Fig. 3 h, the distributions of OH+ and [C i] are spatially well correlated. While the CO distribution is confined in the east side and the center of the outer rim, the OH+ and [C i] distributions extend to the west side of the outer western rim; OH+ and [C i] also trace the inner rim, and their distributions are well correlated with the molecular hydrogen H2 2.122 μm line distribution through the entire region covered by the SPIRE FTS. This suggests that the extended OH+ and [C i] emission arises from the illuminated surface of the molecular clumps.
According to PDR models (Hollenbach & Tielens 1999), the [C i] emission layer traces the illuminated cloud surface i.e., the east side of the outer western rim that faces the exciting star. However, this structure is not seen in our maps of the [C i] and CO (J = 5–4) distributions in Fig. 6c. Instead, the distribution of the [C i] emission coincides with the CO emission along the center of the outer rim, but extends farther to the west side of the outer rim, correlating spatially with the H2 and OH+ distributions. Young et al. (1999) observed the Helix nebula in the CO J = 2–1 line with a velocity resolution of 1.5 km s-1, revealing a complex velocity structure and suggesting that the nebula consists of an expanding equatorial ring with arcs and filaments extending around the ionized cavity. O’Dell et al. (2004) suggested that the Helix is composed of an inner disk surrounded by an outer ring inclined 23° to the plane of the sky. Recently, Zeigler et al. (2013) mapped the Helix at the J = 1–0 transition of HCO+ at 89 GHz at high spectral resolution ( 1.68 km s-1). The HCO+ map reveals the Helix to be a barrel-like structure composed of two bipolar outflows inclined 10° to the east with respect to the line of sight. The bi-polar structure was previously suggested by Meaburn et al. (2005). The high-velocity material forms blue- and red-shifted disks. The inner western rim is part of the blue-shifted disk and the outer western rim is part of the red-shifted disk. The discrepancy observed between the [C i] and CO J = 5–4 distributions and the predicted structure of PDR models, as well as the particular atomic and molecular stratification observed toward both western rims, might be caused by projection effects due to the tilted barrel-like shape and the fact that the western rims are not co-located in the plane of the sky but separated by at least 0.3 pc.
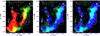 |
Fig. 6 Three composite images showing the distribution of different atoms, ions, and molecules along the western rims of the Helix nebula. a) [N ii] at 1461 GHz in red, CO (J = 5–4) in green. Yellow areas are the regions where [N ii] emission coincides with CO (J = 5–4) emission. b) CO (J = 5–4) in green and OH+ in blue. c) CO (J = 5–4) in green and [C i] ( |
The observed spatial distributions of CO and [C i] require a clumpy environment within a nebula. Clumps have relatively high optical depths, shielding UV radiation and protecting molecules in the inner layers. The UV radiation can penetrate farther between clumps (Spaans 1996; Kramer et al. 2008), which are filled with ionized gas. For molecular gas in clumps within the ionized region of a nebula, PDRs are formed at the surface of the clumps, dissociating the CO molecules on the surfaces of clumps facing the central star, and also throughout the diffuse gas between the clumps (Speck et al. 2002). Therefore, the CO emission likely arises from the highest density gas component in the clumps.
4.2. CO photodissociation and OH+ formation
The entire Helix nebula contains a rich variety of molecules (Young et al. 1999; Tenenbaum et al. 2009; Zack & Ziurys 2013). In the rims, the abundance of CO is probably regulated by photodissociation by UV photons. Molecules are expected to be destroyed in the photodissociation fronts. The FUV (far-ultraviolet) field passing through the inner western rim dissociate the CO molecules. Once CO is photodissociated, oxygen can form OH+ via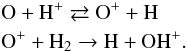 The formation of H+ via cosmic ray ionizations or X-rays is followed by recombination of H+ with electrons and with neutral or negatively charged polycyclic aromatic hydrocarbons (see detailed models in Hollenbach et al. 2012). The fact that the Helix nebula is devoid of PAHs (Hora et al. 2006) probably enhances the formation of OH+ through the western rims. The strong X-ray emission at energies ~1 keV observed in the Helix nebula (Leahy et al. 1994; Guerrero et al. 2001), most likely increases the hydrogen ionization rates and this may enhance the formation of OH+. However, NGC 6853 does not show such strong X-ray emission; NGC 6853 presents low X-rays consistent with photospheric emission at energies ~0.2 keV (Kastner et al. 2012) similar to the low X-ray emission observed in the Helix nebula. The spectrum of NGC 6853 also shows OH+ lines in emission (forthcoming paper), suggesting that the strong X-ray emission observed in the Helix nebula, may not be relevant to the formation of OH+.
The CO molecules are photodissociated through the inner rim. This would explain the weak CO emission detected almost below the SPIRE FTS detection limit, and the good correlation between the [C i] and OH+ emission observed along the inner rim where CO molecules are photodissociated.
The UV radiation reaching the outer western rim penetrates between the clumps, photodissociating the CO molecules throughout the entire rim. The brightest CO emission is spread along the center of the outer western rim. In this region, the CO photodissociation is reduced by shielding H2, dust, and shelf-shielding. The dust continuum emission and N(H2) peak along the center of the outer western rim, where N(CO) ~ 1.2 × 1015 cm-2. The photodissociation of CO is strongly reduced at CO column densities higher than 1015 cm-2 (Bally & Langer 1982; Lee et al. 1996). Beyond the center region of the outer western rim, the molecular hydrogen and CO column densities are lower than in the center of the rim; CO photodissociation is more efficient and the CO intensities again drop below the SPIRE FTS detection limit, and only [C i] and OH+ are detected.
Once OH+ is formed, it is destroyed by reactions with electrons and H2 (Hollenbach et al. 2012). Depending on their relative contribution, the oxygen chemistry will proceed and ultimately form water vapor: The non-detection of H2O+ and H3O+ suggests that the OH+ emission traces low-molecular fraction gas through the western rims of the Helix nebula (Neufeld et al. 2010). The ortho-H2O line at 557.3 GHz is also detected (see Fig. 2), although this line is much weaker than the OH+ lines. The fact that only the H2O ground-state transition is detected suggests that water vapor emission probably arises from cooler shielded clumps.
4.3. Carbon column density and CH+ non-detection
The fine structure [C i] lines are one of the best diagnostic tools to probe the PDR structures. It is the major form of carbon in the neutral gas of the Helix and contributes to the cooling of the gas. The [C i] column densities estimated with MADEX are N(C I) ~ 6.5 × 1015 cm-2 at the eastern edge of the outer western rim with a Tk ~ 40 K and n(H2) ~ 105 cm-3. Along the outer western rim, where the CO and the [C i] (–) line surface brightness maps peak, the column densities are N(C I) ~ 1016 cm-2. The kinetic temperatures required to reproduce the intensities of the [C i] (– ) and (–) lines through the outer rim are in the range Tk ~ 75–95 K and so higher than those inferred from CO. These values are in good agreement with those inferred by Young et al. (1997).
Young et al. (1997) detected a high abundance of [C i] relative to CO (N[C i]/N(CO) ~ 6). We measured similar values at the edges of the outer western rim, but in the center of the rim, where the [C i] and the CO surface brightness maps show the highest emission, the ratio can reach values up to N[C i]/N(CO) ~ 9. The OH+ emission peaks at the same position as [C i], in the center of the outer western rim. The detection of OH+ and [C i] indicates an efficient OH+ excitation mechanism and the ongoing photodissociation of the CO molecules by the central star’s strong UV field or X-rays in the nebula’s rims.
When CO is dissociated in an oxygen-rich planetary nebula with a C/O ratio close to 1, the free carbon atoms, if ionized (C+) could form CH+ (see Nagy et al 2013 for the Orion Bar case). However, the CH+J = 1–0 line at 835.17 GHz is not detected in the Helix, although it is present in bright carbon-rich PNs such as NGC 7027 where CH+ formation is dominated by reaction of vibrationally excited H2 with C+ (Cernicharo et al. 1997; Agúndez et al. 2010). The reason for the absence of CH+ might be a C+ deficit, because other reactions destroy C+ very efficiently. Other carbon-bearing molecules have been detected in the Helix nebula, such as HCN, HCO+, CN (Bachiller et al. 1997), H2CO, CCH, and C3H2 (Tenenbaum et al. 2009). These molecules survive despite the strong radiation field, shielded inside the clumps composed of gas-phase molecules mixed with dust, with densities as high as 105 cm-3 (Howe et al. 1994). The compounds H2CO, OH, and H2O are easily formed in the dense photodissociation regions of protoplanetary nebulae (Cernicharo et al. 1989; Cernicharo 2004). Our SPIRE FTS data do not cover the OH lines, but indicate abundance for H2O from its fundamental line at 557 GHz. The lack of emission from high excitation lines suggests that H2O is restricted to the densest and coldest regions, and that it could either be a remnant of the AGB phase of the star or be produced by similar mechanisms to those proposed for CRL 618 by Cernicharo (2004), which also lead to the formation of OH and H2CO.
5. Summary and conclusions
We have reported the first detection of extended OH+ lines in emission in a planetary nebula. Independently and simultaneously, OH+ lines in emission have been detected in several oxygen-rich planetary nebula by Aleman et al. (2013), observed as part of the HerPlans project. Their work is also presented in this volume.
Herschel SPIRE FTS spectra display several atomic and molecular emission lines along the western rims of the Helix nebula. The intensity maps of the atoms and molecules detected trace the dissociation of CO molecules and the stratification of the PDR along the outer western rims. The CO lines arise from dense and shielded clumps in the western rims of the Helix nebula. The OH+ and [C i] lines likely trace the clump’s surfaces where molecules reform after being photodissociated. Both the OH+ and [C i] distributions are spatially coincident peaking at the same position in the outer western rim. The [N ii] line traces the diffuse ionized gas in the interclump medium.
Acknowledgments
We thank ASTROMADRID for funding support through the grant S2009ESP-1496, the consolider programme ASTROMOL: CSD2009-00038, and the Spanish MINECO (grants AYA2009-07304 and AYA2012-32032). F.K. is supported by the FWF project P23586 and the ffg ASAP project HIL. P.v.H. and P.R. acknowledge support from the Belgian Science Policy Office (Belspo) through the ESA PRODEX program. HIPE is a joint development by the Herschel Science Ground Segment Consortium consisting of ESA, the NASA Herschel Science Center, and the HIFI, PACS, and SPIRE consortia. SPIRE has been developed by a consortium of institutes led by Cardiff University (UK) and including University of Lethbridge (Canada); NAOC (China); CEA, LAM (France); IFSI, Univ. Padua (Italy); IAC (Spain); Stockholm Observatory (Sweden); Imperial College London, RAL, UCL-MSSL, UKATC, Univ. Sussex (UK); and Caltech, JPL, NHSC, Univ. Colorado (USA). This development has been supported by national funding agencies: CSA (Canada); NAOC (China); CEA, CNES, CNRS (France); ASI (Italy); MCINN (Spain); SNSB (Sweden); STFC, UKSA (UK); and NASA (USA).
References
- Agúndez, M., Goicoechea, J. R., Cernicharo, J., et al. 2010, ApJ, 713, 662 [NASA ADS] [CrossRef] [Google Scholar]
- Aleman, I., Ueta, T., & Ladjal, D. 2014, A&A, 566, A79 [NASA ADS] [CrossRef] [EDP Sciences] [Google Scholar]
- Ali, A., Shalabiea, O. M., El-Nawawy, M. S., & Millar, T. J. 2001, MNRAS, 325, 881 [NASA ADS] [CrossRef] [Google Scholar]
- Bachiller, R., Forveille, T., Huggins, P. J., & Cox, P. 1997, A&A, 324, 1123 [NASA ADS] [Google Scholar]
- Bally, J., & Langer, W. D. 1982, AJ, 261, 747 [NASA ADS] [CrossRef] [Google Scholar]
- Cernicharo, J. 2004, ApJ, 608, 41 [Google Scholar]
- Cernicharo, J. 2012, in ECLA-2011: Proc. European Conf. on Laboratory Astrophysics, eds. C. Stehlé, C. Joblin, & L. d’Hendecourt, EAS Pub. Ser. [Google Scholar]
- Cernicharo, J., Guelin, M., Penalver, J., Martín-Pintado, J., & Mauersberger, R. 1989, A&A, 1222, L1 [NASA ADS] [Google Scholar]
- Cernicharo, J., Liu, X.-W, González-Alfonso, E., et al. 1997, ApJ, 483, L65 [NASA ADS] [CrossRef] [Google Scholar]
- Cox, P., Boulanger, F., Huggins, P. J., et al. 1998, ApJ, 495, 23 [Google Scholar]
- Deguchi, S., & Goldsmith, P. F. 1985, Nature, 317, 336 [NASA ADS] [CrossRef] [Google Scholar]
- Dyson, J. E., Hartquist, T. W., Pettini, M., & Smith, L. J. 1989, MNRAS, 241, 625 [NASA ADS] [CrossRef] [Google Scholar]
- Etxaluze, M., Goicoechea, J. R., & Cernicharo, J. 2013, A&A, 556, A137 [NASA ADS] [CrossRef] [EDP Sciences] [Google Scholar]
- Gerin, M., de Luca, M., & Black, J. 2010, A&A, 518, L110 [NASA ADS] [CrossRef] [EDP Sciences] [Google Scholar]
- Goicoechea, J. R., Etxaluze, M., Cernicharo, J., et al. 2013, ApJ, 769, 13 [NASA ADS] [CrossRef] [Google Scholar]
- Griffin, M. J., Abergel, A., Abreu, A., et al. 2010, A&A, 518, L3 [Google Scholar]
- Guerrero, M. A., Chu, Y.-H., Gruendl, R. A., Williams, R. M., & Kaler, J. B. 2001, ApJ, 553, 55 [Google Scholar]
- Gupta, H., Rimmer, P., Pearson, J. C., et al. 2010, A&A, 521, A47 [Google Scholar]
- Harris, H. C., Dahn, C. C., Canzian, B., et al. 2007, AJ, 133, 631 [NASA ADS] [CrossRef] [Google Scholar]
- Henry, R. B. C., Kwitter, K. B., & Dufour, R. J. 1999, ApJ, 517, 782 [NASA ADS] [CrossRef] [Google Scholar]
- Hollenbach, D. J., & Tielens, A. G. G. M. 1999, Rev. Mod. Phys., 71, 173 [Google Scholar]
- Hollenbach, D. J., Kaufman, M. J., Neufeld, D., Wolfire, M., & Goicoechea, J. R. 2012, ApJ, 754, 105 [NASA ADS] [CrossRef] [Google Scholar]
- Hora, J. L., Latter, W. B., Smith, H. A., & Marengo, M. 2006, ApJ, 652, 426 [NASA ADS] [CrossRef] [Google Scholar]
- Howe, D. A., Hartquist, T. W., & Williams, D. A. 1994, MNRAS, 271, 811 [NASA ADS] [CrossRef] [Google Scholar]
- Huggins, P. J., Forveille, T., & Bachiller, R. 2002, ApJ, 573, 55 [Google Scholar]
- Kastner, J. H., Montez, R., Jr., Balick, B., et al. 2012, AJ, 144, 58 [NASA ADS] [CrossRef] [EDP Sciences] [Google Scholar]
- Kramer, C., Cubick, M., Rölling, M., et al. 2008, A&A, 477, 547 [NASA ADS] [CrossRef] [EDP Sciences] [Google Scholar]
- Leahy, D. A., Zhang, C. Y., & Kwok, S. 1994, ApJ, 422 205 [Google Scholar]
- Lee, H.-H., Herbst, E., Pineau des Forets, G., Roueff, E., & Le Bourlot, J. 1996, A&A, 311, 690 [NASA ADS] [Google Scholar]
- Leene, A., & Pottasch 1987, A&A, 173, 145 [NASA ADS] [Google Scholar]
- Makiwa, G., Naylor, D. A., Ferlet, M., et al. 2013, Appl. Opt., 52, 16 [Google Scholar]
- Matsuura, M., Speck, A. K., Smith, M. D., et al. 2007, MNRAS, 382, 1447 [NASA ADS] [CrossRef] [Google Scholar]
- Matsuura, M., Speck, A. K., McHunu, B. M., et al. 2009, ApJ, 700, 106 [Google Scholar]
- Meaburn, J., & Bounis, P. 2010, MNRAS, 402, 381 [NASA ADS] [CrossRef] [Google Scholar]
- Meaburn, J., Boumis, O., López, J. A., et al. 2005, MNRAS, 360, 963 [NASA ADS] [CrossRef] [Google Scholar]
- Meixner, M., Young Owl, R., & Leach, R. W. 1999, PASP, 111, 997 [NASA ADS] [CrossRef] [Google Scholar]
- Meixner, M., McCullough, P., Hartman, J., Son, M., & Speck, A. 2005, AJ, 130, 1784 [NASA ADS] [CrossRef] [Google Scholar]
- Nagy, Z., Van der Tak, F. F. S., & Ossenkopf, V. 2013, A&A, 550, A96 [NASA ADS] [CrossRef] [EDP Sciences] [Google Scholar]
- Napiwotzki, R. 1999, A&A, 305, 101 [NASA ADS] [Google Scholar]
- Neufeld, D. A., Goicoechea, J. R., & Sonnentrucker, P. 2010, A&A, 521, 10 [Google Scholar]
- O’Dell, C. R. 1998, AJ, 116, 1346 [NASA ADS] [CrossRef] [Google Scholar]
- O’Dell, C. R., McCullough, P. R., & Meixner, M. 2004, AJ, 128, 2339 [NASA ADS] [CrossRef] [Google Scholar]
- O’Dell, C. R., Henney, W. J., & Ferland, G. J. 2005, AJ, 130, 172 [NASA ADS] [CrossRef] [Google Scholar]
- Ott, S. 2010, in Astronomical Data Analysis Software and Systems XIX, eds. Y. Mizumoto, K.-I. Morita, & M. Ohishi, ASP Conf. Ser., 434, 139 [Google Scholar]
- Pilbratt, G. L., Riedinger, J. R., Passvogel, T., et al. 2010, A&A, 518, L1 [CrossRef] [EDP Sciences] [Google Scholar]
- Spaans, M. 1996, A&A, 307, 271 [NASA ADS] [Google Scholar]
- Speck, A. K., Meixner, M., Fong, D., et al. 2002, ApJ, 123, 346 [Google Scholar]
- Spinoglio, L., Pereira-Santaella, M., Busquet, G., et al. 2012, ApJ, 758, 108 [NASA ADS] [CrossRef] [Google Scholar]
- Tenenbaum, E. D., Milam, S. N., Woolf, N. J., & Ziurys, L. M. 2009, ApJ, 704, 108 [Google Scholar]
- Traulsen, I., Hoffmann, A. I. D., Rauch, T., et al. 2005, in 14th European Workshop on White Dwarfs, eds. D. Koester, & S. Moehler, ASP Conf. Ser., 334, 325 [Google Scholar]
- Ueta, T., Ladjal, D., & HerPlaNS Team 2012, in Circumstellar Dynamics at High Resolution, eds. A. C., Carciofi, & T., Rivinius, ASP Conf. Ser., 464, A59 [Google Scholar]
- van der Tak, F. F. S., Nagy, Z., Ossenkopf, V., et al. 2013, A&A, 560, A95 [NASA ADS] [CrossRef] [EDP Sciences] [Google Scholar]
- van der Werf, P. P., Isaak, K. G., Meijerink, R., et al. 2010, A&A, 521, A44 [NASA ADS] [CrossRef] [EDP Sciences] [Google Scholar]
- Warner, J. W., & Rubin, V. C. 1975, ApJ, 198, 593 [NASA ADS] [CrossRef] [Google Scholar]
- Wyrowski, F., Menten, K. M., Güsten, R., & Belloche, A. 2010, A&A, 518, A26 [NASA ADS] [CrossRef] [EDP Sciences] [Google Scholar]
- Young, K., Cox, P., Huggins, P. J., Forveille, T., & Bachiller, R. 1997, ApJ, 482, L101 [NASA ADS] [CrossRef] [Google Scholar]
- Young, K., Cox, P., Huggins, P. J., Forveille, T., & Bachiller, R. 1999, ApJ, 522, 387 [NASA ADS] [CrossRef] [Google Scholar]
- Zack, L. N., & Ziurys, L. 2013, ApJ, 765, 112 [Google Scholar]
- Zeigler, N. R., Zack, L. N., Woolf, N. J., & Ziurys, L. M. 2013, ApJ, 788, 16 [NASA ADS] [CrossRef] [Google Scholar]
All Tables
Trot (K), N(CO) (cm-2), and n(H2) (cm-3) throughout the outer western rim of the Helix nebula. Trot ~ Tk.
All Figures
|
Fig. 1 Footprint of the five SPIRE FTS observations over the SPIRE 250 μm photometric image. White circles show the layout of the unvignetted field of view (FoV ~ 2.0 arcmin in diameter) of the four Must-Do observations, and the white-dashed circle shows the FoV of the pvanhoof observation. The total area coverage by the five observations is ~6 × 8 arcmin2. Layout of the FTS detector arrays (SLW in green and SSW in red) and the FoV (black) is shown in the lower-right corner. The circle sizes of the detectors correspond to the FWHM of the beam. Black contours trace levels: 10, 12.5, 15, 17.5, and 20 MJy sr-1. |
| In the text | |
|
Fig. 2 Line profiles of the atomic and molecular lines observed with SPIRE-FTS in the western rims of the Helix nebula. To reduce the sidelobes, the spectra were apodized with an extended Norton-Beer function (FWHM = 15′′) to a resolution of 0.072 cm-1. Bottom right: the spectral lines are observed at four positions along the western rims, two positions in the inner rim (B in red, C in blue), and two positions in the outer rim (A in black, D in green). |
| In the text | |
|
Fig. 3 a), c), and e) surface brightness maps of [N ii] at 1461 GHz, CO (J = 5–4), and OH+ at 971.8 GHz, respectively. The contours of these maps are overlaid on the SPIRE 250 μm image: b), d), and f), respectively. g) shows the image of the surface brightness of [C i] (2–1), and h) shows the contours of the [C i] (2–1) intensity distribution overplotted on the OH+ 971.8 GHz map. All the maps are centered at RA(J2000) = 22h29m16.3s, Dec(J2000) = −20°50′25.96′′. The maps are resampled with a scale of 6′′/pixel. |
| In the text | |
|
Fig. 4 Bottom: co-added SPIRE FTS spectra of three SLW detectors covering the center of the outer western rim. Top: co-added SPIRE FTS spectra of three SLW detectors covering the west side of the outer western rim. |
| In the text | |
|
Fig. 5 a) Footprint of the SLW array (target T5) over the outer western rim. b) CO rotational diagrams showing the column density per statistical weight versus the energy of the upper level. The CO rotational diagrams are measured at seven different positions along the outer western rim (SLWC2, SLWC3, SLWC4, SLWC5, SLWB2, SLWD1, and SLWD3). c) Integrated CO intensities fitted with non-LTE models at the same seven positions previously mentioned. |
| In the text | |
|
Fig. 6 Three composite images showing the distribution of different atoms, ions, and molecules along the western rims of the Helix nebula. a) [N ii] at 1461 GHz in red, CO (J = 5–4) in green. Yellow areas are the regions where [N ii] emission coincides with CO (J = 5–4) emission. b) CO (J = 5–4) in green and OH+ in blue. c) CO (J = 5–4) in green and [C i] ( |
| In the text | |
Current usage metrics show cumulative count of Article Views (full-text article views including HTML views, PDF and ePub downloads, according to the available data) and Abstracts Views on Vision4Press platform.
Data correspond to usage on the plateform after 2015. The current usage metrics is available 48-96 hours after online publication and is updated daily on week days.
Initial download of the metrics may take a while.