Fig. 3
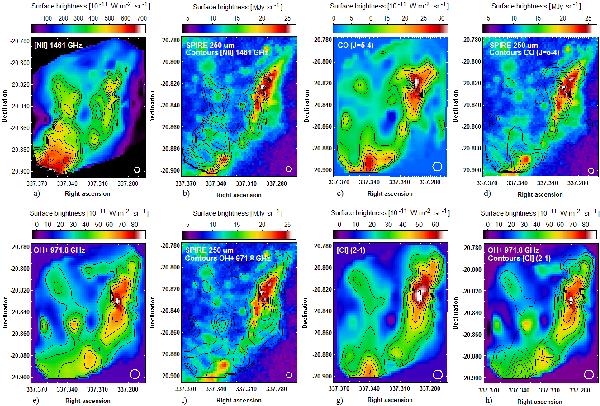
a), c), and e) surface brightness maps of [N ii] at 1461 GHz, CO (J = 5–4), and OH+ at 971.8 GHz, respectively. The contours of these maps are overlaid on the SPIRE 250 μm image: b), d), and f), respectively. g) shows the image of the surface brightness of [C i] (2–1), and h) shows the contours of the [C i] (2–1) intensity distribution overplotted on the OH+ 971.8 GHz map. All the maps are centered at RA(J2000) = 22h29m16.3s, Dec(J2000) = −20°50′25.96′′. The maps are resampled with a scale of 6′′/pixel.
Current usage metrics show cumulative count of Article Views (full-text article views including HTML views, PDF and ePub downloads, according to the available data) and Abstracts Views on Vision4Press platform.
Data correspond to usage on the plateform after 2015. The current usage metrics is available 48-96 hours after online publication and is updated daily on week days.
Initial download of the metrics may take a while.