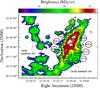
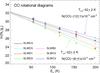
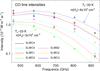
Fig. 5

a) Footprint of the SLW array (target T5) over the outer western rim. b) CO rotational diagrams showing the column density per statistical weight versus the energy of the upper level. The CO rotational diagrams are measured at seven different positions along the outer western rim (SLWC2, SLWC3, SLWC4, SLWC5, SLWB2, SLWD1, and SLWD3). c) Integrated CO intensities fitted with non-LTE models at the same seven positions previously mentioned.
Current usage metrics show cumulative count of Article Views (full-text article views including HTML views, PDF and ePub downloads, according to the available data) and Abstracts Views on Vision4Press platform.
Data correspond to usage on the plateform after 2015. The current usage metrics is available 48-96 hours after online publication and is updated daily on week days.
Initial download of the metrics may take a while.