Fig. 9
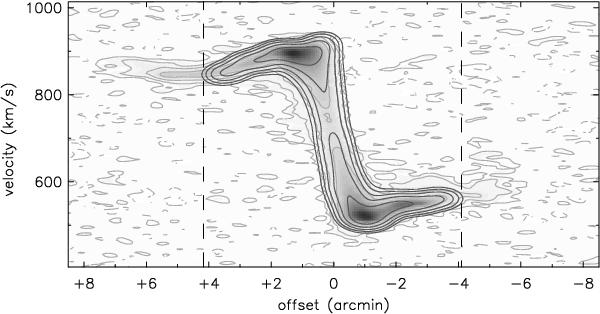
Overlay of the best TiRiFiC model of the inner disk on the major axis pV diagram. The data is shown in gray-scale and light-gray contours. The model in black contours. For both, the lowest contour level shown is 1.5σ. Subsequent contour levels each increase by a factor 2.5. For the data, the dashed contours also show the −1.5σ level. The vertical dashed lines delimit the inner disk.
Current usage metrics show cumulative count of Article Views (full-text article views including HTML views, PDF and ePub downloads, according to the available data) and Abstracts Views on Vision4Press platform.
Data correspond to usage on the plateform after 2015. The current usage metrics is available 48-96 hours after online publication and is updated daily on week days.
Initial download of the metrics may take a while.