Fig. 1
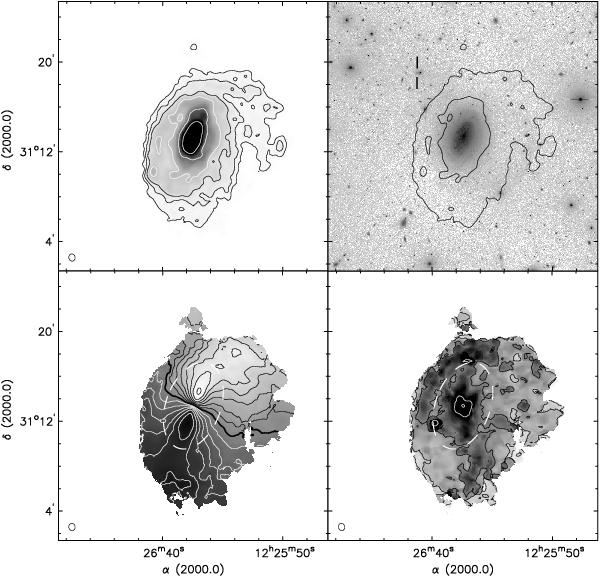
Overview of NGC 4414 derived from the 30′′ tapered data cube. Top-left: integrated H i intensity map (zeroth moment). The contour levels shown are (2,5,10) × 1019 cm-2 (black) and (2,5,10) × 1020 cm-2 (white). Top-right: integrated H i intensity overplotted on a deep KPNO B-band image. The optical image is shown using a logarithmic intensity scale. Contours shown are (2,20) × 1019 cm-2. The two short vertical lines indicate galaxy SDSS J122646.27+311904.8, as discussed in Sect. 4.2. Bottom-left: intensity-weighted mean first-moment velocity field. The thick black countour shows the systemic velocity of 711.5 km s-1. Black contours then decrease in steps of 25 km s-1, white contours increase in steps of 25 km s-1. The dashed white ellipse indicates the division between inner and outer disk as defined in Sect. 3. Bottom-right: second-moment velocity dispersion map. Black contours show values of (5, 10, 20) km s-1 (light-gray to dark-gray background). White contours show (50, 100) km s-1 (dark-gray to black background). The white ellipse indicates the division between inner and outer disk.
Current usage metrics show cumulative count of Article Views (full-text article views including HTML views, PDF and ePub downloads, according to the available data) and Abstracts Views on Vision4Press platform.
Data correspond to usage on the plateform after 2015. The current usage metrics is available 48-96 hours after online publication and is updated daily on week days.
Initial download of the metrics may take a while.