Fig. 7
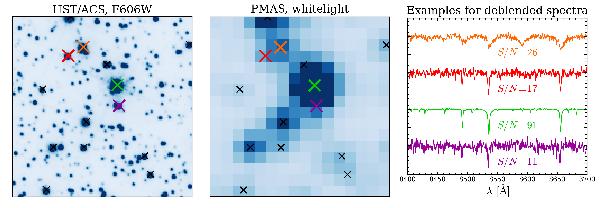
Example spectra deblended from the central PMAS pointing in M13. The left panel shows an HST image of the region, a white light image of our PMAS data is shown in the central panel. In both panels, black crosses indicate the positions where single stellar spectra were extracted. The spectra of the four sources marked by coloured crosses are depicted in the right panel, the calculated S/N is given below each spectrum. The colour coding used to plot the spectra and to indicate their positions is the same in all three panels.
Current usage metrics show cumulative count of Article Views (full-text article views including HTML views, PDF and ePub downloads, according to the available data) and Abstracts Views on Vision4Press platform.
Data correspond to usage on the plateform after 2015. The current usage metrics is available 48-96 hours after online publication and is updated daily on week days.
Initial download of the metrics may take a while.