Fig. 6
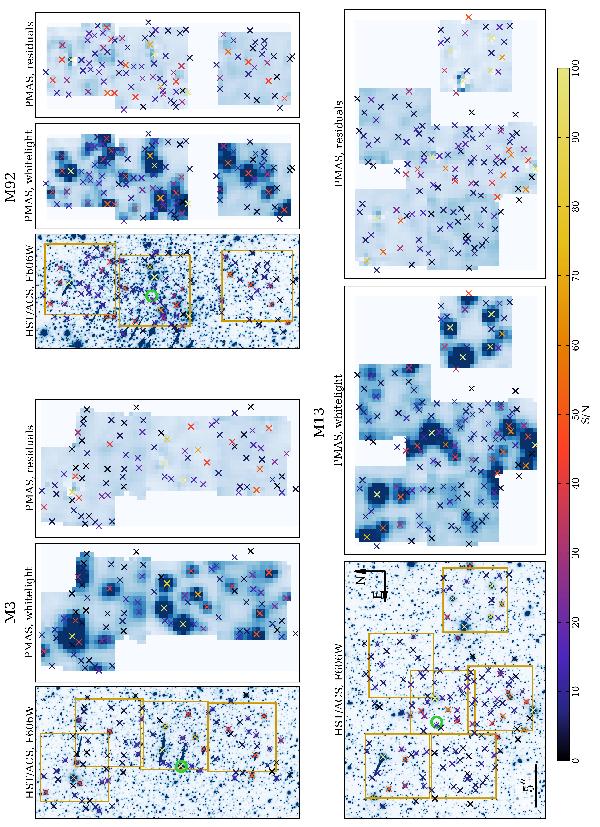
Results of the deblending of the stellar spectra. For each cluster the panels show, from left to right: an HST image of the central region with the PMAS pointings overplotted, a white light image of the combined PMAS data, and the residuals from the PMAS data after the sources were subtracted. In each HST panel, a green circle marks the cluster centre. We highlight the positions of the extracted spectra by coloured crosses, with the colour coding of the crosses matched to the S/N of the respective spectrum as indicated by the colour bar below the panels.
Current usage metrics show cumulative count of Article Views (full-text article views including HTML views, PDF and ePub downloads, according to the available data) and Abstracts Views on Vision4Press platform.
Data correspond to usage on the plateform after 2015. The current usage metrics is available 48-96 hours after online publication and is updated daily on week days.
Initial download of the metrics may take a while.