Fig. 5
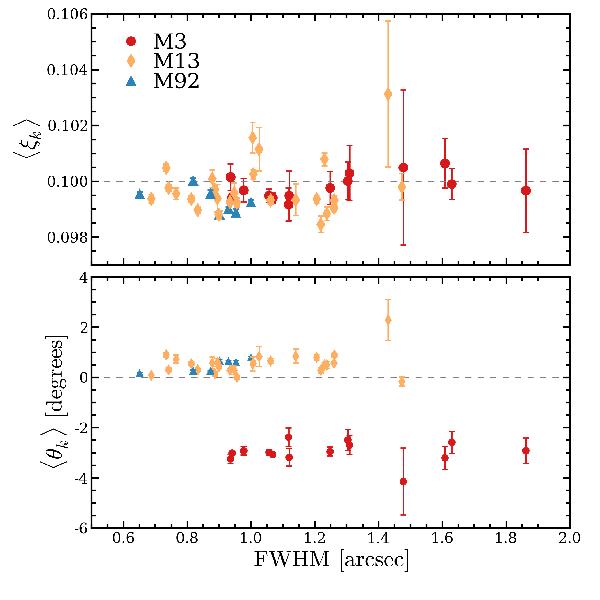
Average spatial scaling factors (top) and rotation angles (bottom) of all PMAS datacubes with respect to the reference catalogue. As in Fig. 4, the error bars represent the standard deviations over the cubes, including variations with wavelength. Dashed lines in both panels show the values expected for the nominal characteristics of PMAS in the instrument setup that was used.
Current usage metrics show cumulative count of Article Views (full-text article views including HTML views, PDF and ePub downloads, according to the available data) and Abstracts Views on Vision4Press platform.
Data correspond to usage on the plateform after 2015. The current usage metrics is available 48-96 hours after online publication and is updated daily on week days.
Initial download of the metrics may take a while.