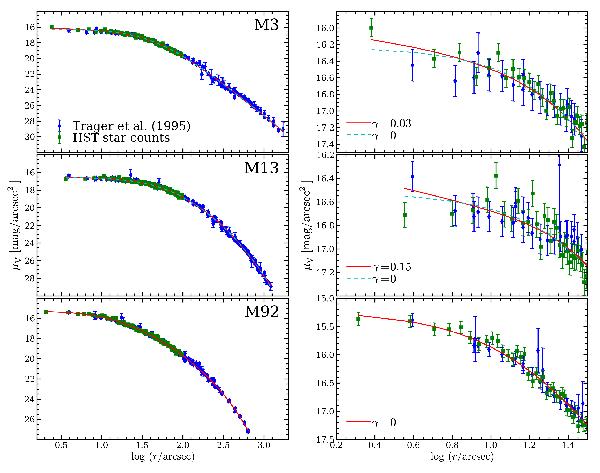
Fig. 2

Left-hand side: surface brightness profiles of the clusters M3, M13, and M92 over the entire extent of each cluster. Right-hand side: zoom into the central region of each cluster. Measurements based on star counts in the HST data are shown using green squares while blue diamonds represent the data of Trager et al. (1995). A solid red line shows the best-fit extended Nuker profile. For M3 and M13, we also show a Nuker profile with a core (i.e. γ = 0) as a dashed cyan line. The surface brightness profiles have been corrected for extinction.
Current usage metrics show cumulative count of Article Views (full-text article views including HTML views, PDF and ePub downloads, according to the available data) and Abstracts Views on Vision4Press platform.
Data correspond to usage on the plateform after 2015. The current usage metrics is available 48-96 hours after online publication and is updated daily on week days.
Initial download of the metrics may take a while.


