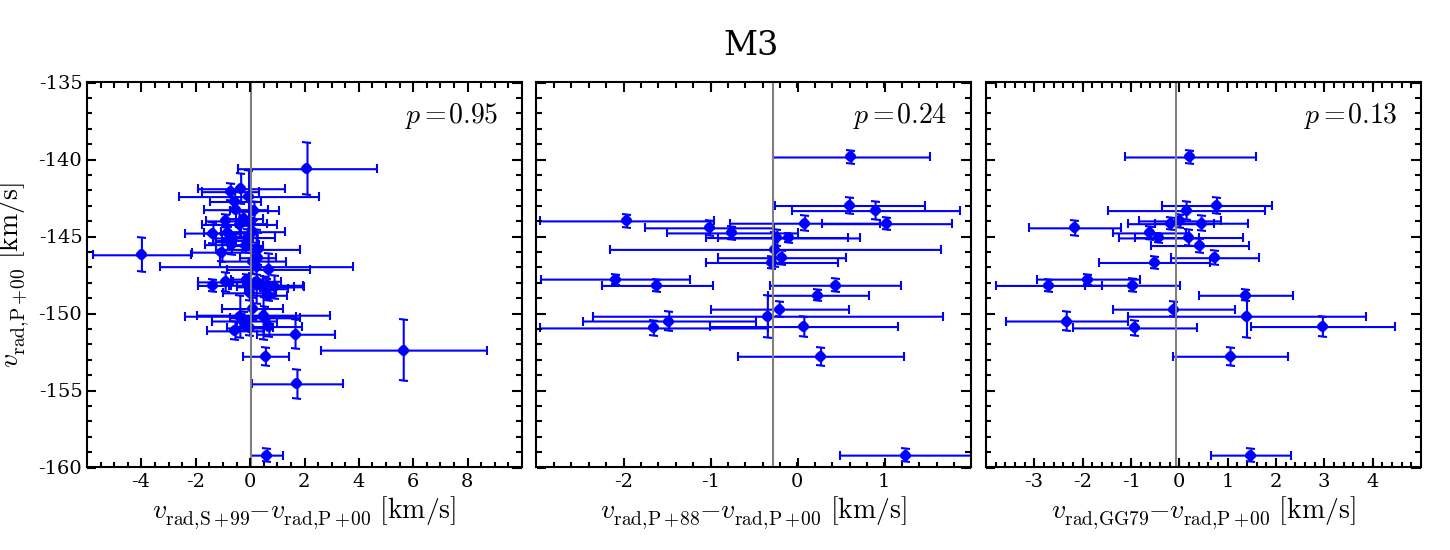
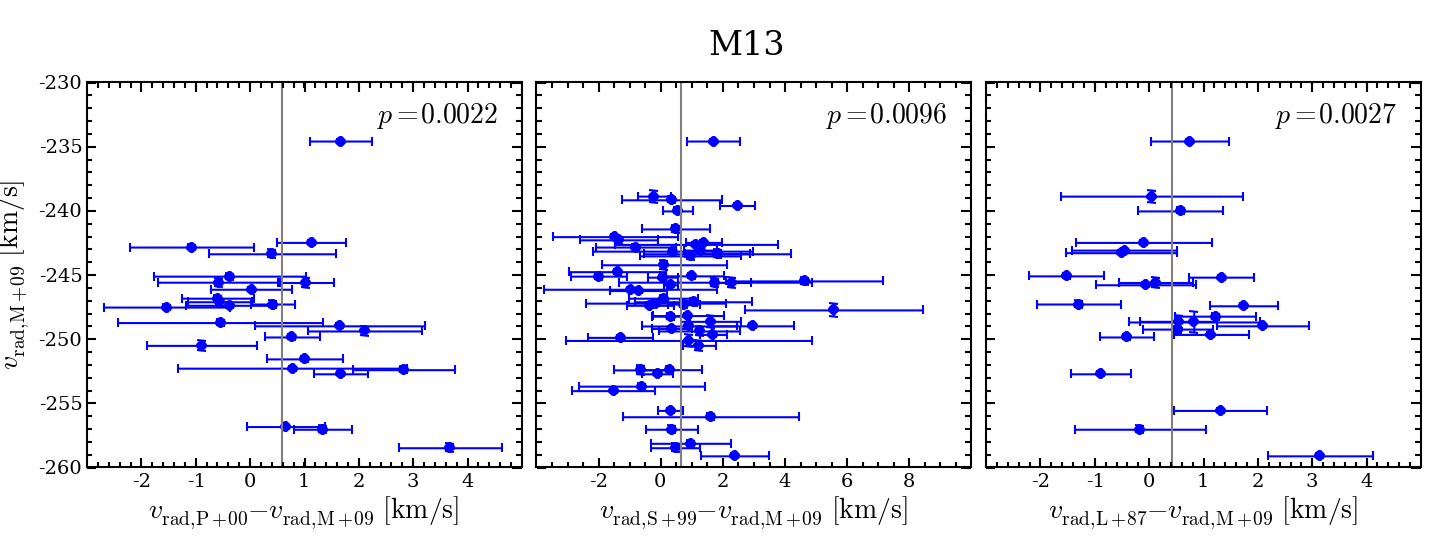
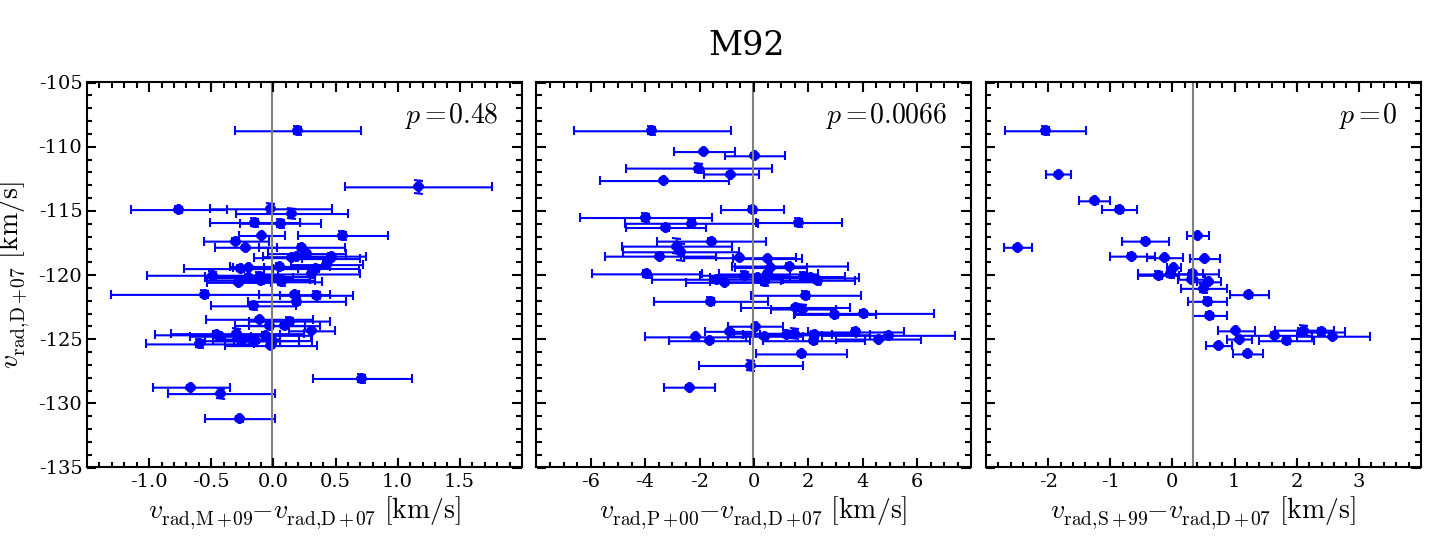
Fig. C.1
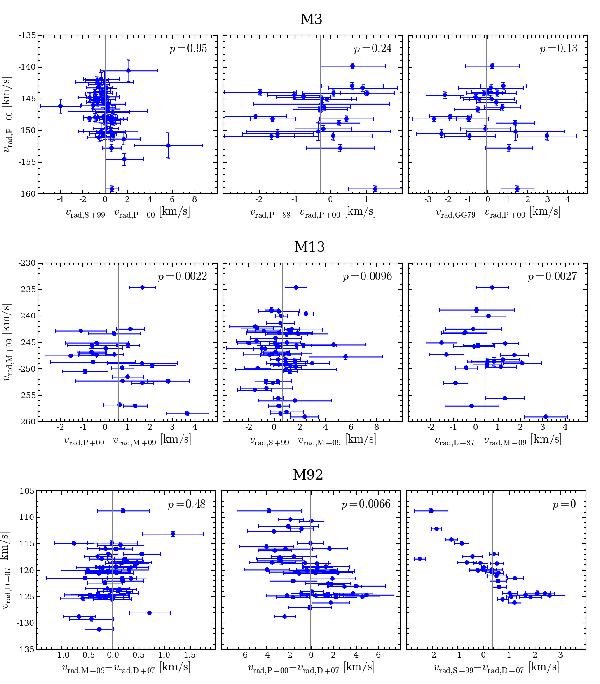
Comparison of the different literature datasets in M3 (top), M13 (centre), and M92 (bottom). The different panels show the offsets in the measured radial velocities between the various studies and the reference study for stars present in both samples. The probability that the scatter of the individual offsets is consistent with the provided uncertainties is given in the upper right corner of each panel. The abbreviations used to denote the individual studies are given in Table 4.
Current usage metrics show cumulative count of Article Views (full-text article views including HTML views, PDF and ePub downloads, according to the available data) and Abstracts Views on Vision4Press platform.
Data correspond to usage on the plateform after 2015. The current usage metrics is available 48-96 hours after online publication and is updated daily on week days.
Initial download of the metrics may take a while.