Fig. B.1
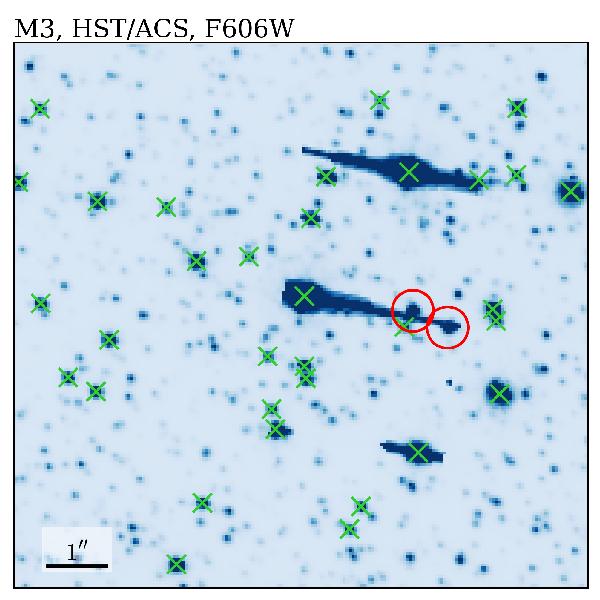
Illustration of incompleteness in the ACS input catalogue, using the central region of M3. Green crosses indicate sources included in the ACS catalogue, sources marked by red circles were added after a comparison with archival WFPC2 photometry. For clarity, only stars with I-band magnitudes brighter than 17 are highlighted. The cluster centre is located directly on the central bright star.
Current usage metrics show cumulative count of Article Views (full-text article views including HTML views, PDF and ePub downloads, according to the available data) and Abstracts Views on Vision4Press platform.
Data correspond to usage on the plateform after 2015. The current usage metrics is available 48-96 hours after online publication and is updated daily on week days.
Initial download of the metrics may take a while.