Fig. A.1
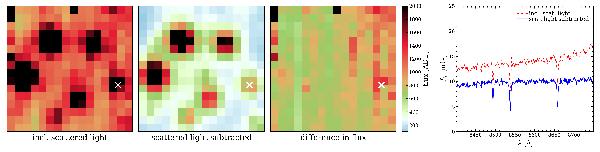
Effect of scattered light in our PMAS data. For a reduced data cube of our central PMAS pointing in M3 the first three panels show, from left to right, a white light image with the scattered light still included, a white light image with the scattered light subtracted, and the difference in flux between the two. All images are displayed on the same intensity scale indicated by the colour bar on the right-hand side of the plot. The rightmost panel compares the spectra extracted for the star marked by a white cross in the PMAS data before and after the scattered light subtraction.
Current usage metrics show cumulative count of Article Views (full-text article views including HTML views, PDF and ePub downloads, according to the available data) and Abstracts Views on Vision4Press platform.
Data correspond to usage on the plateform after 2015. The current usage metrics is available 48-96 hours after online publication and is updated daily on week days.
Initial download of the metrics may take a while.