Fig. 12
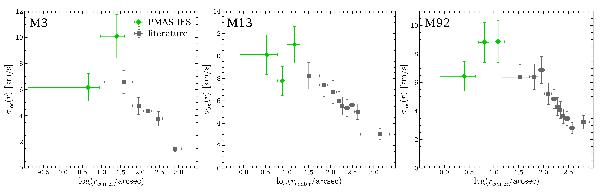
Velocity dispersion as a function of projected distance to the cluster centre for M3, M13, and M92. The PMAS data and the literature data were analysed separately in the sense that no bin included data from both sets. Note that the horizontal bars do not represent error bars but indicate the range in radii covered by the individual bins.
Current usage metrics show cumulative count of Article Views (full-text article views including HTML views, PDF and ePub downloads, according to the available data) and Abstracts Views on Vision4Press platform.
Data correspond to usage on the plateform after 2015. The current usage metrics is available 48-96 hours after online publication and is updated daily on week days.
Initial download of the metrics may take a while.