Fig. 1
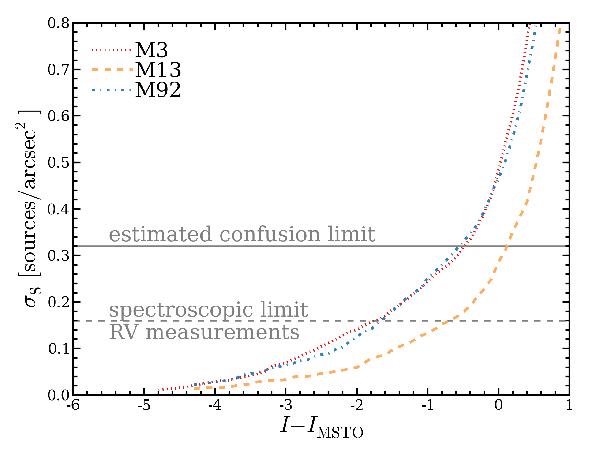
Central surface number densities of sources brighter than a given magnitude for the three clusters of our sample, colour-coded as indicated in the upper left corner of the plot. Magnitudes are given relative to the main sequence turn-off (MSTO) in each cluster. The solid horizontal line corresponds to the source density where we expect to hit the confusion limit. Below the density indicated by a dashed line the deblended spectra will likely have a sufficient signal-to-noise ratio for radial velocity (RV) determination.
Current usage metrics show cumulative count of Article Views (full-text article views including HTML views, PDF and ePub downloads, according to the available data) and Abstracts Views on Vision4Press platform.
Data correspond to usage on the plateform after 2015. The current usage metrics is available 48-96 hours after online publication and is updated daily on week days.
Initial download of the metrics may take a while.