| Issue |
A&A
Volume 565, May 2014
|
|
|---|---|---|
| Article Number | A66 | |
| Number of page(s) | 6 | |
| Section | Atomic, molecular, and nuclear data | |
| DOI | https://doi.org/10.1051/0004-6361/201423589 | |
| Published online | 13 May 2014 | |
Accurate rest-frequencies of ketenimine (CH2CNH) at submillimetre wavelength⋆
1
Dipartimento di Chimica “G. Ciamician”Università di Bologna,
via F. Selmi 2,
40126
Bologna,
Italy
e-mail: This email address is being protected from spambots. You need JavaScript enabled to view it.
; This email address is being protected from spambots. You need JavaScript enabled to view it.
2
Centro de Astronomia e Astrofísica, Observatório Astronómico de
Lisboa, Tapada da
Ajuda, 1349-018
Lisboa,
Portugal
e-mail:
This email address is being protected from spambots. You need JavaScript enabled to view it.
Received:
6
February
2014
Accepted:
20
March
2014
Abstract
Context. Imine compounds are thought to have a role in the interstellar formation of complex organic species, including pre-biotic molecules. Ketenimine (CH2CNH) is one of the four imines discovered in space. It was identified in Sgr B2(N-LMH) through the detection of three rotational lines in absorption.
Aims. We present an extensive laboratory study of the ground-state rotational spectrum of CH2CNH at submillimetre wavelengths, aimed at obtaining accurate rest-frequencies for radio-astronomical searches.
Methods. The investigation was carried out using a source-modulation microwave spectrometer equipped with a cell that is coupled to a pyrolysis apparatus working at 1000°. The spectrum was recorded in the frequency range 80–620 GHz with the detection of 150 transitions.
Results. The newly measured transition frequencies were analysed with previously available microwave and far-infrared data, yielding accurate rotational constants of CH2CNH, the complete sets of quartic and sextic centrifugal distortion constants, and three octic constants. Several transitions exhibit a hyperfine structure due to the quadrupole and spin-rotation couplings of the 14N nucleus, which were accounted for in the analysis.
Conclusions. The determined spectroscopic constants allowed for the computation of a list of highly accurate rest-frequencies for astrophysical purposes in the submillimetre and THz region with 1σ uncertainties that are lower than 0.1 km s-1 in radial equivalent velocity.
Key words: molecular data / methods: laboratory: molecular / techniques: spectroscopic / radio lines: ISM
Full Tables 1 and 3 are only available at the CDS via anonymous ftp to cdsarc.u-strasbg.fr (130.79.128.5) or via http://cdsarc.u-strasbg.fr/viz-bin/qcat?J/A+A/565/A66
© ESO, 2014
1. Introduction
The discovery of important pre-biotic molecules in a number of carbonaceous chondrite meteorites (e.g., 80 amino acids identified in the Murchison meteorites; Cronin & Chang 1993) has triggered an intense investigation on the origin and distribution of the extraterrestrial, biologically relevant molecules (see Woon 2002; Blagojevic et al. 2003; Elsila et al. 2007). It is well recognized that cold gas-phase chemistry can efficiently form small molecules, such as HCN and simple carbon chains (Herbst 1995).
Efficient accretion of atoms and molecules onto interstellar dust grains and subsequent reactions leads to the formation of more complex species (Tielens & Hagen 1982; Schutte 1999), which may then be returned to the interstellar gas via ice evaporation and drive more gas-phase reactions (Charnley et al. 1992; Caselli et al. 1993; Nomura & Millar 2004). As the molecular cloud collapses to form a proto-star and later a proto-planetary disk, part of this organic material may survive and can be incorporated into comets and other small bodies (Ehrenfreund & Charnley 2000).
Recent laboratory studies on interstellar ice analogues have shown that hydrogenation reactions of CN-bearing molecules on the grain surface leads to the formation of methylamine and amino-acetonitrile (recently detected in Sgr B2(N) by Belloche et al. 2008), which are important building-blocks for biomolecules (Theule et al. 2011; Danger et al. 2011). In these processes, imines (molecules containing the C=NH moiety) play a prime role as either hydrogenation intermediate of nitriles or precursors for fully saturated amine compounds (Theule et al. 2011). They thus provide a synthetic route that bypasses the need for co-spatial aldehyde compounds and ammonia, as implied by the Strecker reaction scenario (Danger et al. 2011).
To date, four imine compounds have been detected in space. The simplest member, methanimine (CH2NH), was first identified by Godfrey et al. (1973) towards Sgr B2. Later on, it was also detected outside the galactic centre in giant molecular clouds (Dickens et al. 1997) and also towards dark and translucent clouds (Turner et al. 1999). It is noteworthy that methanimine has been also observed in outer galaxies, namely, in Arp220 (Salter et al. 2008) and, tentatively, in NGC 253 (Martín et al. 2006). Subsequently, 3-imino-1,2-propadienylidene (CCCNH) was detected by Kawaguchi et al. (1992) in TMC 1, whereas ketenimine (CH2CNH) and the E- and Z-isomers of ethanimine (CH3CHNH) were identified towards the giant molecular cloud complex Sgr B2, a preeminent region in the Galaxy for molecular line studies.
The detection of ketenimine was accomplished through the observation of three lines in absorption at centimetre wavelengths towards the Sgr B2 (N-LMH) pointing position (Lovas et al. 2006). A radiative transfer analysis of the three transitions yielded a single-state temperature Ts = 65 K and a ketenimine column density of ~1.5 × 1016 cm-2. Both these results are significantly uncertain as they depend on the beam dilution factor and can only be refined through interferometric observations to accurately determine the source size. Ketenimine completed a triad of C2H3N isomers identified in Sgr B2, which included CH3CN and CH3NC (Lovas et al. 2006): the assessment of whether these species are co-spatial, and an accurate relative abundance comparison also must await complementary high-resolution observations.
The Atacama Large Millimetre Array (ALMA) – which has already started Cycle 1 observations – is a perfectly suited tool to provide deep insights on the imine chemistry in massive star-forming regions. In this context, the availability of very accurate rest-frequencies (ideally, directly measured in laboratory) is of prime importance, particularly if one aims at carrying out studies on chemically-rich regions, where extremely crowded spectra are usually observed at millimetre and submillimetre wavelengths.
The first investigation on the rotational spectrum of ketenimine was carried out by Rodler et al. (1984), who recorded 36 a-type and c-type transitions in the 18–200 GHz frequency interval. The spectral analysis yielded values of rotational and quartic centrifugal distortion constants and also estimates of the 14N-quadrupole coupling constants and the dipole moment components, μa = 0.434(1) D and μc = 1.371(6) D. The molecule was produced by low-pressure pyrolysis of 2-cyanoethanol (HOCH2CH2CN) at 800°C. A subsequent paper of the same authors (Rodler et al. 1986) was focused on a few c-type transitions recorded below 8 GHz and revealed the small splitting caused by the inversion motion of the imino hydrogen.
A series of high-resolution infrared (IR) studies were then performed on ketenimine. Ito et al. (1990) and Ito & Nakanaga (2010) recorded the ν4 and ν6 bands, and, recently, several Fourier transform infrared (FTIR) studies of Coriolis-perturbed bands, involving low-lying vibrational states, have also been reported (Bane et al. 2011c,b,a). In addition, ground state Q-branch rotational transitions were also recorded in the far-infrared (FIR) region using a synchrotron source and a FTIR spectrometer (Bane et al. 2011b).
The limited and sparse frequency coverage of the old rotational measurements (Rodler et al. 1984, 1986) prevents the calculation of very accurate predictions for submillimetre (sub-mm) lines. Indeed, 1σ uncertainties exceeding 0.5 MHz are estimated for many lines already at 1 mm wavelength. The subsequent FTIR studies of the ν7, ν8, and ν12 bands (Bane et al. 2011b) provided a huge number of ground state combination differences (estimated uncertainties 2.8 × 10⁻⁴ cm-1, i.e., 8 MHz) from which an improved set of ground state rotational parameters of CH2CNH was calculated.
However, most astrochemical studies are carried out using ground-based telescopes which usually observe pure rotational lines falling into the atmospheric windows (3 mm to 0.4 mm wavelength), and a systematic study of the sub-mm spectrum of ketenimine – aimed at obtaining highly-accurate rest-frequencies – is still lacking. Indeed, for these spectral data, predictions derived from laboratory measurements of rotational spectra are inherently more accurate than those obtained from infrared spectroscopy and are, thus, more adequate for the radio-astronomical needs. The present paper presents a very comprehensive investigation of the rotational spectrum of CH2CNH up to 620 GHz, which aims to build the most complete and accurate set of spectroscopic constants that are useful to generate a list of precise rest-frequencies for rotational lines of astrophysical interest in the in the sub-mm wave region.
2. Experiments
Ketenimine was produced by gas-phase pyrolysis of the 5-membered ring molecule isoxazole (C3H3NO) by using the same apparatus employed in this laboratory to produce other molecules of astrophysical interest, such as HC5N (Yamada et al. 2004), HC7N (Bizzocchi & Degli Esposti 2004), C3O (Bizzocchi et al. 2008), and CH2NH (Dore et al. 2012). The vapours of the stable precursor were flowed through a quartz tube (50 cm long and 1 cm in diameter) that was placed into a 30 cm long cylindrical furnace heated to 1000° and then introduced in the absorption cell, which is a glass tube 3 m long and 10 cm in diameter, through which the pyrolysis products were continuously pumped. A pressure of ca. 10 mTorr (1.33 Pa) was maintained in the absorption cell.
Measurements were carried out in the frequency range of 80–620 GHz by employing phase-locked Gunn oscillators as primary radiation sources that covered the 60–115 GHz interval; higher frequencies were obtained by harmonic multiplication. Two phase-lock loops allowed the stabilisation of the Gunn oscillator with respect to a frequency synthesiser, which was driven by a 5 MHz rubidium frequency standard. The frequency modulation of the radiation was obtained by a 6 kHz sine-wave, which modulates the reference signal of the wide-band Gunn synchronizer. The absorption signal, detected by a Schottky-barrier diode below 200 GHz (Millitech DXW-08) or by a liquid-helium-cooled InSb hot electron bolometer at higher frequencies (QMC Instr. Ltd. type QFI/2), was demodulated at 2f by a lock-in amplifier, so that the second derivative of the actual spectrum was recorded. The accuracy of the frequency measurements, which was estimated from a line shape analysis of repeated measurements, was in the range 10–20 kHz, depending on width, distortion, and signal-to-noise ratio of the lines.
3. Analysis
The CH2CNH is a near-prolate (κ = −0.998) asymmetric rotor, whose C=C=N–H nuclei lie in the ac symmetry plane, and the heavy C=C=N frame is approximately aligned with the a principal axis. The molecule has dipole moment components along the a and c axes, so that a-type and c-type transitions occur in its rotational spectrum. A total number of 150 new rotational transitions have been recorded, which are R (ΔJ = +1) and Q (ΔJ = 0) a-type lines, and R, Q, and P (ΔJ = −1) c-type lines, spanning J values from 0 to 67, Ka values from 0 to 9, and upper state energies from 7 to 1477 cm-1.
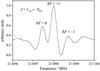 |
Fig. 1 Recording of the hyperfine triplet of the 11,0 ← 00,0 transition of CH2CNH in its vibrational ground state. Total integration time 145 s at 990 kHz/s with time constant of 10 ms. |
A fairly large number of the recorded transitions show a hyperfine structure due to the
electric quadrupole coupling of the 14N nucleus (I = 1). An example is given in Fig. 1, which shows the recording of the 11,0−00,0 transition, for which all the three
expected hyperfine components are well resolved. In most cases, however, only doublets were
observed because of the merging of a pair of hyperfine components; in such occurrences, the
transition frequency of the unresolved doublet was assumed to result from the averaging of
the two components weighted by their relative intensities. Owing to the hyperfine structure,
a total number of 162 line frequencies were measured. The coupling scheme adopted for the
analysis is  (1)thus,
each energy level is labelled using the asymmetric rotor quantum numbers JKa,Kc
plus the “total” angular momentum quantum number F. This latter quantum number is, however,
significant only when the hyperfine structure of a given
(1)thus,
each energy level is labelled using the asymmetric rotor quantum numbers JKa,Kc
plus the “total” angular momentum quantum number F. This latter quantum number is, however,
significant only when the hyperfine structure of a given
 transition is
resolved. For single lines with no resolvable hyperfine structure, the peak frequency is the
unperturbed rotational transition frequency. No inversion splitting could be observed in any
of the recorded lines, not even as a partially resolved shoulder of the profile. Inversion
splitting was therefore totally neglected in our analysis.
transition is
resolved. For single lines with no resolvable hyperfine structure, the peak frequency is the
unperturbed rotational transition frequency. No inversion splitting could be observed in any
of the recorded lines, not even as a partially resolved shoulder of the profile. Inversion
splitting was therefore totally neglected in our analysis.
Absorption frequencies of the rotational transitions that were previously recorded in the microwave (Rodler et al. 1984) and FIR regions (Bane et al. 2011b) were added to our measurements to obtain a larger set of data. Different statistical weights (w = 1/σ2) were given to the frequencies employed to take the different measurement precisions into account. Generally, σ values of 50 and 10 kHz were assigned to the old microwave measurements and the present measurements, respectively; however, larger uncertainties were given to the frequencies of a few lines with a bad signal-to-noise ratio or with a profile that is partially overlapped with a weak transitions from a side species produced in the pyrolysis. An uncertainty of 5 × 10⁻⁴ cm-1 (15 MHz) was assigned to the FIR measurements.
Assignments, measured line positions, and least-squares residuals for the analysed transitions of ketenimine.
In this way, a total number of 297 different line frequencies were fitted, employing the Pickett’s SPFIT fitting program (Pickett 1991), to an asymmetric rotor Hamiltonian using the Watson’s S-reduced Ir representation (Watson 1977). The complete list of the analysed rotational transitions is provided as electronic supplementary material at the CDS1. An excerpt is reported in Table 1.
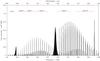 |
Fig. 2 Simulation of the rotational spectrum of CH2CNH. Intensities are computed at 50 K. |
Predicted rest frequencies, estimated accuracies, and lines strengths for the ground vibrational state of ketenimine.
Nearly all of the analysed rotational transition frequencies could be well fitted using a
single-state Hamiltonian, since perturbations due to the weak centrifugal resonance, which
couples the ground state to the lowest energy modes ν8 and
ν12 (Bane et
al. 2011b), were detected only for a few a-dipole transitions with
 . The latter transitions could be well
fitted by adopting the interaction scheme of Bane et al.
(2011b), in which off-diagonal matrix elements that originate from the
. The latter transitions could be well
fitted by adopting the interaction scheme of Bane et al.
(2011b), in which off-diagonal matrix elements that originate from the
 ro-vibrational Hamiltonian must be considered. The spectroscopic constants determined by the
least-squares analysis of the available transition frequencies are listed in Table 2, where previous results (Bane et al. 2011b) are also reported for comparison. The first column contains the
results that are obtained using a single-state Hamiltonian with the exclusion of the
a-dipole transitions with . All quartic and sextic centrifugal
distortion constants could be determined with few octic terms. The 14N electric quadrupole and
magnetic spin-rotation coupling constants were also fitted. The second column contains the
results obtained by considering the vibrational ground state coupled to the low energy modes
ν8
(466 cm-1) and
ν12 (409 cm-1) through off-diagonal matrix
elements generated by the
ro-vibrational Hamiltonian (Urban & Yamada
1993). Note that the least-squares residuals shown in Table 1 refer to this latter
calculation.
ro-vibrational Hamiltonian must be considered. The spectroscopic constants determined by the
least-squares analysis of the available transition frequencies are listed in Table 2, where previous results (Bane et al. 2011b) are also reported for comparison. The first column contains the
results that are obtained using a single-state Hamiltonian with the exclusion of the
a-dipole transitions with . All quartic and sextic centrifugal
distortion constants could be determined with few octic terms. The 14N electric quadrupole and
magnetic spin-rotation coupling constants were also fitted. The second column contains the
results obtained by considering the vibrational ground state coupled to the low energy modes
ν8
(466 cm-1) and
ν12 (409 cm-1) through off-diagonal matrix
elements generated by the
ro-vibrational Hamiltonian (Urban & Yamada
1993). Note that the least-squares residuals shown in Table 1 refer to this latter
calculation.
In the case of ketenimine, the non-zero resonant terms are (Bane et al. 2011b): ![Mathematical equation: \begin{eqnarray} \label{eq:Hres} \tilde{H}_{12}\mrm{(res)} = -\omega_8 q_8 C_8^{ab}\,\left[\hat{J}_b,\hat{J}_a\right]_+ - \omega_{12} q_{12} C_{12}^{ac}\,\left[\hat{J}_c,\hat{J}_a\right]_+, \end{eqnarray}](/articles/aa/full_html/2014/05/aa23589-14/aa23589-14-eq84.png) (2)where
the [ , ]+ symbol represents the anticommutator. Centrifugal resonance
effects in the ground state can thus be treated by fitting two further spectroscopic
constant,
(2)where
the [ , ]+ symbol represents the anticommutator. Centrifugal resonance
effects in the ground state can thus be treated by fitting two further spectroscopic
constant,  and
and
 , which have
the following general form:
, which have
the following general form:  (3)in
which ωs is the harmonic
frequency of the normal mode s, and
(3)in
which ωs is the harmonic
frequency of the normal mode s, and  is the
adimensional rotational derivative relative to the principal axes α,β (Papoušek & Aliev 1982).
is the
adimensional rotational derivative relative to the principal axes α,β (Papoušek & Aliev 1982).
The treatment of this kind of resonance requires spectroscopic information on the
interacting excited states (mainly vibrational energies and rotational constants). These
data were taken from the previous ro-vibrational analysis of the ν8 and
ν12 IR bands (Bane et al. 2011b) and held fixed in our least-squares analysis of ground-state
rotational transitions. Adopting the above-mentioned resonance scheme, it was also possible
to well reproduce the measured a-dipole transitions with Ka ranging from 7 to 9, and
the least-squares analysis was finally optimized by releasing the off-diagonal parameter
, whilst
was held fixed
at the values determined by Bane et al. (2011b); the
two parameters are indeed fully correlated if only ground-state transition frequencies are
analysed. The quality of the fit is rather good, since root-mean-squares (rms) deviations
are 26 kHz and 4.8 ×
10-4 cm-1 for microwave and FTIR measurements, respectively. If
the oldest rotational frequencies (Rodler et al.
1984) are removed from the data set, then a rms deviation as low as 9.4 kHz is
obtained for the newly measured frequencies.
4. Discussion
This paper considerably extends the laboratory study of the rotational spectrum of ketenimine into the millimetre and submillimetre-wave regions from 80 to 620 GHz; a-type (R, Q branches) and c-type (R,Q,P branches) transitions were recorded sampling states with the rotational quantum number J ranging from 0 to 67 and its projection Ka from 0 to 9. These newly measured rotational frequencies, along with the old microwave measurements and the recent rotational FIR data, allowed us to determine an enlarged and more precise set of rotational and centrifugal distortion constants. Inspection of Table 2, where the results of the present work are compared with previous determinations, shows that one more quartic, four sextic, and two octic centrifugal distortion constants could be determined from the analysis of the available rotational frequencies. In addition, the precision of the already known constants has been improved on average, by one order of magnitude. As a consequence, predictive capabilities at millimetre and submillimetre wavelengths have appreciably been improved. As an example, we can mention that the newly measured c-type, Ka = 2−1 transitions were found considerably displaced from the predictions obtained with the previously determined constants (up to several MHz for high-J transitions): their inclusion in the present fit has allowed a reduction of the model-dependent uncertainties due to previous neglect of higher-order centrifugal distortion constants.
Figure 2 illustrates a simulation of the rotational
spectrum up to 1 THz computed at a temperature of 50 K; it shows that the strongest
interstellar transitions of CH2CNH lie in the ALMA bands 9 and 10. The results of the
present work now permit the calculation of very precise rest frequencies over the whole
spectral interval of interest for present-day astrochemical studies. These laboratory data
could also be useful to support the analysis of the wealth of submillimetre spectral data
collected by the Herschel guaranteed time survey projects which targeted
star forming regions (e.g., HEXOS, Neill et al. 2012;
and CHESS, Ceccarelli et al. 2010). Table 3 (supplementary data available at the CDS, an excerpt is
reported in the text) contains the line catalogue obtained using the SPCAT program (Pickett 1991) and the spectroscopic constants of the
second column of Table 2. The data listing includes
the following: the 1σ prediction uncertainties (calculated taken into
account the correlations between spectroscopic constants), the upper state energies, the
lines strengths factors Sijμ2,
and the Einstein’s A coefficients for spontaneous emission. These latter
were evaluated as:  (4)where
all the quantities are expressed in SI units and the line strengths Sij are obtained projecting
the squared rotation matrix onto the basis set that diagonalises the rotational Hamiltonian
(Benz et al. 1966; Gordy & Cook 1984). The prediction sample comprises 954 lines selected in
the frequency range 100 GHz <ν< 1
THz, which have upper state energy Eupp <
70 cm-1, and Einstein’s coefficient A >
10-8 s-1. The 14N-hyperfine structure has been retained for all the
transitions; thus, many lines presented in the list appear are closely spaced or overlapped
triplets.
(4)where
all the quantities are expressed in SI units and the line strengths Sij are obtained projecting
the squared rotation matrix onto the basis set that diagonalises the rotational Hamiltonian
(Benz et al. 1966; Gordy & Cook 1984). The prediction sample comprises 954 lines selected in
the frequency range 100 GHz <ν< 1
THz, which have upper state energy Eupp <
70 cm-1, and Einstein’s coefficient A >
10-8 s-1. The 14N-hyperfine structure has been retained for all the
transitions; thus, many lines presented in the list appear are closely spaced or overlapped
triplets.
The frequency precision is fairly high: on average, it is a few parts of 108 over the whole spectral range (1 part in 108 corresponds to to 0.003 km s-1 in radial velocity) with the largest uncertainties affecting the lines with significant centrifugal-distortion or resonance contributions. Still, the present set of predicted uncertainties are model dependent: this means that additional Hamiltonian terms, which are indeterminable with present data, can cause these to increase. The present set of spectroscopic constants, as determined from measurements up to 620 GHz, yields, however, a fairly reliable prediction of the rotational spectrum of ketenimine at submillimetre wavelengths, particularly for the low-J and low-Ka transitions listed in Table 3.
Acknowledgments
Financial support from MIUR (PRIN 2012 funds, project STAR) and from the University of Bologna (RFO funds) is gratefully acknowledged. L.B. gratefully acknowledges support from the Science and Technology Foundation (FCT, Portugal) through Fellowship SFRH/BPD/62966/2009.
References
- Bane, M. K., Robertson, E. G., Thompson, C. D., Appadoo, D. R. T., & McNaughton, D. 2011a, J. Chem. Phys., 135, 4306 [Google Scholar]
- Bane, M. K., Robertson, E. G., Thompson, C. D., et al. 2011b, J. Chem. Phys., 134, 4306 [CrossRef] [Google Scholar]
- Bane, M. K., Thompson, C. D., Robertson, E. G., Appadoo, D. R. T., & McNaughton, D. 2011c, Phys. Chem. Chem. Phys., 13, 6793 [CrossRef] [Google Scholar]
- Belloche, A., Menten, K. M., Comito, C., et al. 2008, A&A, 482, 179 [NASA ADS] [CrossRef] [EDP Sciences] [Google Scholar]
- Benz, H. P., Bauder, A., & Günthard, H. H. 1966, J. Mol. Spectr., 21, 156 [NASA ADS] [CrossRef] [Google Scholar]
- Bizzocchi, L., & Degli Esposti, C. 2004, ApJ, 614, 518 [NASA ADS] [CrossRef] [Google Scholar]
- Bizzocchi, L., Degli Esposti, C., & Dore, L. 2008, A&A, 492, 875 [NASA ADS] [CrossRef] [EDP Sciences] [Google Scholar]
- Blagojevic, V., Petrie, S., & Bohme, D. K. 2003, MNRAS, 339, L7 [NASA ADS] [CrossRef] [Google Scholar]
- Caselli, P., Hasegawa, T. I., & Herbst, E. 1993, ApJ, 408, 548 [NASA ADS] [CrossRef] [Google Scholar]
- Ceccarelli, C., Codella, C., Cabrit, S., et al. 2010, in COSPAR Meeting, 38, 38th COSPAR Scientific Assembly, 2476 [Google Scholar]
- Charnley, S. B., Tielens, A. G. G. M., & Millar, T. J. 1992, ApJ, 399, L71 [NASA ADS] [CrossRef] [Google Scholar]
- Cronin, J. R., & Chang, S. 1993, in The Chemistry of Life’s Origins, eds. J. M. Greenberg, C. X. Mendoza-Gomez, & V. Pirronello (Dordrecht: Kluwer), 209 [Google Scholar]
- Danger, G., Borget, F., Chomat, M., et al. 2011, A&A, 535, A47 [NASA ADS] [CrossRef] [EDP Sciences] [Google Scholar]
- Dickens, J. E., Irvine, W. M., De Vries, C. H., & Ohishi, M. 1997, ApJ, 479, 307 [NASA ADS] [CrossRef] [PubMed] [Google Scholar]
- Dore, L., Bizzocchi, L., & Degli Esposti, C. 2012, A&A, 544, A19 [NASA ADS] [CrossRef] [EDP Sciences] [Google Scholar]
- Ehrenfreund, P., & Charnley, S. B. 2000, ARA&A, 38, 427 [Google Scholar]
- Elsila, J. E., Dworkin, J. P., Bernstein, M. P., Martin, M. P., & Sandford, S. A. 2007, ApJ, 660, 911 [NASA ADS] [CrossRef] [Google Scholar]
- Godfrey, P. D., Brown, R. D., Robinson, B. J., & Sinclair, M. W. 1973, ApL, 13, 119 [Google Scholar]
- Gordy, W., & Cook, R. L. 1984, Microwave molecular spectra (New York: Wiley) [Google Scholar]
- Herbst, E. 1995, Ann. Rev. Phys. Chem., 46, 27 [Google Scholar]
- Ito, F., & Nakanaga, T. 2010, J. Mol. Spectr., 264, 100 [NASA ADS] [CrossRef] [Google Scholar]
- Ito, F., Nakanaga, T., Sugawara, K.-I., et al. 1990, J. Mol. Spectr., 140, 177 [NASA ADS] [CrossRef] [Google Scholar]
- Kawaguchi, K., Takano, S., Ohishi, M., et al. 1992, ApJ, 396, L49 [NASA ADS] [CrossRef] [Google Scholar]
- Lovas, F. J., Hollis, J. M., Remijan, A. J., & Jewell, P. R. 2006, ApJ, 645, L137 [NASA ADS] [CrossRef] [Google Scholar]
- Martín, S., Mauersberger, R., Martín-Pintado, J., Henkel, C., & García-Burillo, S. 2006, ApJS, 164, 450 [NASA ADS] [CrossRef] [Google Scholar]
- Neill, J. L., Crockett, N. R., Bergin, E. A., & HEXOS Team. 2012, in 67th International Symposium on Molecular Spectroscopy, Ohio State University [Google Scholar]
- Nomura, H., & Millar, T. J. 2004, A&A, 414, 409 [NASA ADS] [CrossRef] [EDP Sciences] [MathSciNet] [Google Scholar]
- Papoušek, D., & Aliev, M. R. 1982, Molecular vibrational-rotational spectra (Elsevier) [Google Scholar]
- Pickett, H. M. 1991, J. Mol. Spectr., 148, 371 [NASA ADS] [CrossRef] [Google Scholar]
- Rodler, M., Brown, R. D., Godfrey, P. D., & Tack, L. M. 1984, Chem. Phys. Lett., 110, 447 [NASA ADS] [CrossRef] [Google Scholar]
- Rodler, M., Brown, R. D., Godfrey, P. D., & Kleibömer, B. 1986, J. Mol. Spectr., 118, 267 [NASA ADS] [CrossRef] [Google Scholar]
- Salter, C. J., Ghosh, T., Catinella, B., et al. 2008, AJ, 136, 389 [NASA ADS] [CrossRef] [Google Scholar]
- Schutte, W. A. 1999, in Laboratory Astrophysics and Space Research, eds. P. Ehrenfreund, C. Krafft, H. Kochan, & V. Pirronello (Dordrecht: Kluwer), 69 [Google Scholar]
- Theule, P., Borget, F., Mispelaer, F., et al. 2011, A&A, 534, A64 [NASA ADS] [CrossRef] [EDP Sciences] [Google Scholar]
- Tielens, A. G. G. M., & Hagen, W. 1982, A&A, 114, 245 [NASA ADS] [Google Scholar]
- Turner, B. E., Terzieva, R., & Herbst, E. 1999, ApJ, 518, 699 [NASA ADS] [CrossRef] [Google Scholar]
- Urban, S., & Yamada, K. M. T. 1993, J. Mol. Spectr., 160, 279 [NASA ADS] [CrossRef] [Google Scholar]
- Watson, J. K. G. 1977, in Vibrational Spectra and Structure, ed. J. Durig, 6 (Amsterdam: Elsevier), 1 [Google Scholar]
- Woon, D. E. 2002, ApJ, 571, L177 [NASA ADS] [CrossRef] [Google Scholar]
- Yamada, K. M. T., Degli Esposti, C., Botschwina, P., et al. 2004, A&A, 425, 767 [NASA ADS] [CrossRef] [EDP Sciences] [Google Scholar]
All Tables
Assignments, measured line positions, and least-squares residuals for the analysed transitions of ketenimine.
Predicted rest frequencies, estimated accuracies, and lines strengths for the ground vibrational state of ketenimine.
All Figures
|
Fig. 1 Recording of the hyperfine triplet of the 11,0 ← 00,0 transition of CH2CNH in its vibrational ground state. Total integration time 145 s at 990 kHz/s with time constant of 10 ms. |
| In the text | |
|
Fig. 2 Simulation of the rotational spectrum of CH2CNH. Intensities are computed at 50 K. |
| In the text | |
Current usage metrics show cumulative count of Article Views (full-text article views including HTML views, PDF and ePub downloads, according to the available data) and Abstracts Views on Vision4Press platform.
Data correspond to usage on the plateform after 2015. The current usage metrics is available 48-96 hours after online publication and is updated daily on week days.
Initial download of the metrics may take a while.