| Issue |
A&A
Volume 565, May 2014
|
|
|---|---|---|
| Article Number | A127 | |
| Number of page(s) | 7 | |
| Section | Interstellar and circumstellar matter | |
| DOI | https://doi.org/10.1051/0004-6361/201423550 | |
| Published online | 27 May 2014 | |
SiO masers from AGB stars in the vibrationally excited v = 1, v = 2, and v = 3 states ⋆
1 Observatorio Astronómico Nacional (OAN-IGN), C/ Alfonso XII, 3, 28014 Madrid, Spain
e-mail: This email address is being protected from spambots. You need JavaScript enabled to view it.
2 Observatorio Astronómico Nacional (OAN-IGN), Apartado 112, 28803 Alcalá de Henares, Spain
3 Onsala Space Observatory, Dept. of Earth and Space Sciences, Chalmers University of Technology, 43992 Onsala, Sweden
Received: 31 January 2014
Accepted: 14 March 2014
Abstract
Context. The v = 1 and v = 2 J = 1–0 (43 GHz), and v = 1 J = 2–1 (86 GHz) SiO masers are intense in asymptotic giant branch (AGB) stars and have been mapped using very long baseline interferometry (VLBI) showing ring-like distributions. Those of the v = 1, v = 2 J = 1–0 masers are similar, but the spots are rarely coincident, while the v = 1 J = 2–1 maser arises from a well-separated region farther out. These relative locations can be explained by models tools that include the overlap of two IR lines of SiO and H2O. The v = 3 J = 1–0 line is not directly affected by any line overlap and its spot structure and position, relative to the other lines, is a good test to the standard pumping models.
Aims. The aim of this project are to gain insight into the properties and the general theoretical considerations of the different SiO masers that can help to understand them.
Methods. We present single-dish and simultaneous VLBI observations of the v = 1, v = 2, and v = 3 J = 1–0 maser transitions of 28SiO in several AGB stars. The results are compared to the predictions of radiative models of SiO masers that both include and not include the effect of IR line overlap.
Results. The spatial distribution of the SiO maser emission in the v = 3 J = 1–0 transition from AGB stars is systematically composed of a series of spots that occupy a ring-like structure (as often found in SiO masers). The overall ring structure is extremely similar to that found in the other 43 GHz transitions and is very different from the structure of the v = 1 J = 2–1 maser. The positions of the individual spots of the different 43 GHz lines are, however, very rarely coincident, which in general is separated by about 0.3 AU (between 1 and 5 mas). These results are very difficult to reconcile with standard pumping models, which predict that the masers of rotational transitions within a given vibrational state require very similar excitation conditions (since the levels are placed practically at the same energy from the ground), while the transitions of different vibrational states (which are separated by an energy of 1800 K) should appear in different positions. However, models including line overlap tend to predict v = 1, v = 2, v = 3 J = 1–0 population inversion to occur under very similar conditions, while the requirements for v = 1 J = 2–1 appear clearly different, and are compatible with the observational results.
Key words: stars: AGB and post-AGB / circumstellar matter / masers / radio lines: stars / techniques: interferometric
Maps and spectra in FITS format are only, and Table 3 is also available at the CDS via anonymous ftp to cdsarc.u-strasbg.fr (130.79.128.5) or via http://cdsarc.u-strasbg.fr/viz-bin/qcat?J/A+A/565/A127
© ESO, 2014
1. Introduction
Many asymptotic giant branch (AGB) stars have been mapped in SiO maser emission in the J = 1–0 v = 1 and v = 2 lines1 using very long baseline interferometry (VLBI; Diamond et al. 1994; Desmurs et al. 2000; Cotton et al. 2006, etc.). The maser emission is found to form a ring of spots at a few stellar radii from the center of the star. In general, both distributions are similar, although the spots are very rarely coincident, and the v = 2 ring is slightly closer to the star than the v = 1 ring (see e.g. Desmurs et al. 2000).
The similar distributions of the v = 1, v = 2 J = 1–0 transitions were first interpreted as favoring collisional pumping, because the radiative mechanism discriminates the location of the two masers more. On the contrary, the lack of true coincidence was used to argue in favor of radiative pumping, which leads to the well-known, long-lasting discrepancy in the interpretation of the v = 1, v = 2 J = 1–0 maps in terms of pumping mechanisms; see detailed discussion in Desmurs et al. (2000).
Our understanding of this topic changed dramatically when the first comparisons between the v = 1 J = 1–0 and v = 1 J = 2–1 maser distributions were performed (Soria-Ruiz et al. 2004, 2005, 2007). In contrast to predictions from both models (radiative and collisional), the v = 1 J = 2–1 maser spots are systematically found to occupy a ring with a significantly larger radius (by about 30%) than that of v = 1 J = 1–0, where both spot distributions being completely unrelated. Soria-Ruiz et al. (2004) explained these unexpected results by invoking line overlap between the ro-vibrational transitions v = 2–1 J = 1–0 of SiO and v2 = 0–1 JKa,Kc = 127,5–116,6 of H2O. According to Soria-Ruiz et al. (2004), this phenomenon, which was first proposed by Olofsson et al. (1981) to explain the anomalous weakness of the v = 2 J = 2–1 SiO maser, would also introduce a strong coupling of the v = 1 and v = 2 J = 1–0 lines, explaining their similar distributions.
In the simplest theoretical interpretation (not including line overlap, see Bujarrabal & Rieu 1981; Bujarrabal 1994; Lockett & Elitzur 1992; Humphreys et al. 2002), the v = 3 J = 1–0 emission requires completely different excitation conditions than the other less excited lines, since the Δv = 1 energy separation is very high, ~1800 K. The v = 3 J = 1–0 spatial distribution should in principle be different from the v = 1, v = 2 J = 1–0 ones and, of course, the v = 1 J = 2–1 maser, and placed in a still more inner ring. However, we have seen that line overlap strongly affects the v = 1 and v = 2 J = 1–0 maser pumping. In particular, this phenomenon changes the conditions required to pump both lines, which now tend to require higher densities. In this paper, we compare the v = 1, v = 2, v = 3 J = 1–0 maser distribution and analyzed the results in the framework of the pumping models.
2. Observational data
The main goal of this paper is to present maps with sub-arc resolution in the v = 3 J = 1–0 line and compare them to maps of v = 1 and v = 2 J = 1–0 lines. v = 1 and v = 2 are usually strong masers easy to observe in VLBI, but this is not the case of the much weaker v = 3 lines. This line can be sometimes very intense but it is strongly variable (Alcolea et al. 1989) both in time (with characteristic time scales of a few months) and from object to object. To maximize the success of the interferometric observations, we first initiated a single-dish monitoring program of a sample of 19 AGB stars showing SiO masers. Once an AGB star had a v = 3 flux density above ~5 Jy, we triggered the Very Large Baseline Array (VLBA) to observe the star in the weeks immediately following the single-dish detection.
2.1. Single-dish monitoring of v = 3 J = 1–0 emission
List of sources monitored using the Onsala 20 m Telescope.
We monitored a list of 19 AGB stars, as seen in Table 1, using the 20-m antenna at the Onsala Space Observatory for three years (from December 2008 to December 2011). We simultaneously observed the v = 1, v = 2, v = 3 J = 1–0 lines at 43 GHz in both right and left circular polarizations (except for the two first runs, which are mostly devoted to feasibility check and which we only observed v = 1, v = 3). The spectral resolution was 25 kHz, equivalent to ~0.2 km s-1. As we were interested in searching for strong maser emission that could be later mapped with the VLBA, each source was observed with about 10 min of integration time in position switching mode. For a typical Tsys of ~150 K, this gave us a rms noise of ~0.1 K, which was good enough for our detection purpose.
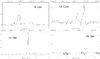 |
Fig. 1 Single-dish spectra of the SiO J = 1–0 v = 3 maser emission from the AGB stars, R Leo (November, 2009), TX Cam (January, 2010), U Her (April, 2011), and IK Tau (October, 2011). The intensity scale is in Jy. |
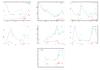 |
Fig. 2 Flux variation intensity (in Jy) with time (phase of the variability cycle of the source) from our monitoring with the Onsala telescope, of v = 1, v = 2, v = 3 (respectively blue cross, green plus and red square, triangles denote upper limits detection) for the sources detected more often than in two epochs in v = 3 J = 1–0. See observing dates in Table 3. |
In total, we carried out 12 observing runs and we detected several sources in v = 3 J = 1–0 emission at different epochs; see Table 3 for a summary of our monitoring results. For each epoch, we searched for candidates that were good enough to be mapped with the VLBA. In Fig. 1, we show the single dish v = 3 J = 1–0 spectra in dates close to the VLBI observations of the four trigger candidates that were selected: R Leo (observing date November 07, 2009, optical phase φ = ~0.42), TX Cam (observing date January 08, 2010, optical phase φ = ~0.71), U Her (observing date April 22, 2011, optical phase φ = ~0.31), and IK Tau (observing date October 30, 2011, optical phase φ = ~0.95). Intensity scale is in Jy; the conversion factor used was F(Jy)/ (K) = 20.
In Fig. 2, we graphically present the flux peak intensity as a function of the variability cycle for sources that were detected at least a couple of times in v = 3 during our monitoring with the Onsala 20 m telescope. From our 19 sources, seven fulfill this condition: IRC+10011, IK Tau, TX Cam, R Leo, U Her, R Cas, and Y Cas. As we can see in Fig. 2, the general trend for all three lines is very similar, and v = 3 seems to follow the same flux variation as the other two lines but is an order of magnitude weaker.
2.2. VLBA mapping
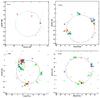 |
Fig. 3 VLBA maps of SiO J = 1–0 v = 1 (in blue), v = 2 (in green), and v = 3 (in red) maser emissions from R Leo (upper left, November 13, 2009), TX Cam (upper right, January 31, 2010), U Her (lower left, April 17, 2011), and IK Tau (lower right, November 04, 2011). To ease the comparison between the three maser lines, using the same color code, we plotted the fitting rings obtained with ODRpack for each maser transition (see Table 2). |
We have used the NRAO2 VLBA to perform quasi-simultaneous observations of the J = 1–0 lines of 28SiO from the first three vibrationally excited states v = 1, v = 2, v = 3, respectively at 43.122, 42.820, and 42.519 GHz, in both left and right circular polarizations and using all available antennas. During the observations, the telescopes periodically switched every two hours between two frequency setups to record the three lines (observing v = 1, v = 2 and v = 2, v = 3). We observed four AGB stars, R Leo on November 13, 2009, TX Cam on January 31, 2010, U Her on April 17, 2011, and IK Tau on November 4, 2011.
The data were correlated in the NRAO correlator at Socorro (New Mexico, USA), which provides 256 frequency channels in the total 8 MHz bandwidth. We therefore attained a spectral resolution of about 0.2 km s-1 within a total velocity coverage of 55 km s-1, which is adequate for accurate line profile analysis and covers the total line width.
The calibration was done using the standard procedures for spectral line VLBI observations in the Astronomical Image Processing System (AIPS) package. The amplitude was calibrated using the template spectra method. Bandpass corrections, single-band delay corrections, and phase errors were corrected by deriving the single-band delay corrections from continuum calibrators. Corrections of fringe-rates were measured by selecting a bright and point-like channel emission and then applied to all the channels. Note that our observations were done using the standard line observing mode without including phase referencing technique, and for the final phase calibration, we have used a maser component as reference; all positions in the resulting maps are thus relative to the location of this spot. Therefore, the absolute positions are lost and only relative positions to the reference channel are obtained. The maps were produced using the CLEAN deconvolution algorithm.
In Fig. 3, we show final maps of the brightness distribution (both polarizations averaged) of 28SiO v = 1, v = 2 and v = 3, J = 1–0 (respectively drawn in blue, green, and red), obtained in R Leo, TX Cam, U Her and IK Tau. Each observation run lasted 8 h, which allows us to reach a rms noise in all the maps of about 5 mJy per channel. All maps were produced with a natural beam resolution of 0.5 mas.
3. Results
We have obtained quasi-simultaneous maps of the three 43 GHz maser lines of SiO, v = 1, v = 2 and v = 3 J = 1–0, as seen in Fig. 3. These are the first VLBA maps ever of the v = 3 J = 1–0 maser. Using VERA, Imai et al. (2012) observed the v = 2, v = 3 J = 1–0 maser emissions in the AGB stars, WX Psc and W Hya, as seen in Imai et al. (2010); a hint of the typical ring-like distribution for the two masers can be seen in their maps but with a much less clear pattern than in our data.
As the absolute position of each map was lost, the alignment of the maps presented in Fig. 3 was obtained by assuming that the centroid of all three distributions is coincident (and coincident with the center of the star) and also by considering the similitude in the velocity and distribution of the spots. In any case, the relative positioning of the different transitions seems very reliable in view of the quite complete ring structures found for all three transitions, and our conclusions are not affected if other reasonable alignments are adopted.
All maps show typical clumpy emission with the spots arranged in a well defined ring distribution. Using a software for weighted Orthogonal Distance Regression (ODRpack3) and taking only the components with S/N ≥ 5 into account, we estimate the mean radius and width of the masing emission for all three transitions for our four sources (see Table 2). For v = 3 in R Leo, it was not possible to fit any circle (see Soria-Ruiz et al. 2005, for more details on the fitting process) due to the low number of maser clumps and their weaknesses. The radius is almost the same for the three transitions. As already known, the v = 2 J = 1–0 maser spots are found to be placed slightly inward than the v = 1 emission, but with a very small difference that is not always detectable (as in the case of IK Tau). The v = 3 J = 1–0 line emission is placed coincident or slightly inward (one clear case is the IK Tau maps) compared to the other two lines, again with a very small difference. The spots of all three lines are forming groups, which can in general be identified for the three lines. However, the individual spots are almost never coincident; even if we allow some relative shift between the different transitions, it is impossible to obtain any significant superposition of the spots (this result was already known for the v = 1, v = 2 lines, as seen in Sect. 1).
Summary of the mean radius and width (in mas) obtained for the three transitions 28SiO v = 1, v = 2, v = 3, J = 1–0 by fitting a ring-like brightness distribution to the observed emission using the regression package ODRpack.
Summary of our three years of monitoring with the Onsala telescope.
The most striking result is the very similar ring-like general distribution of the three lines. This structure is quite different from that found in v = 1 J = 2–1 maps at 86 GHz, which are also ring-like but significantly larger. Soria-Ruiz et al. (2007) found a ring diameter in R Leo of 67 mas of v = 1 J = 2–1 (they found diameters of 58 and 52 mas for J = 1–0 v = 1 and v = 2, respectively). In IRC +10011, Soria-Ruiz et al. (2005) found a ring diameter of about 31.7 mas (and of 23.2 and 21.1 mas for J = 1–0 v = 1 and v = 2, respectively) for v = 1 J = 2–1. This result is particularly difficult to understand if no exotic mechanism like line overlap is invoked (Sect. 1), since the J = 1–0 and J = 2–1 v = 1 transitions require practically the same excitation conditions (They are placed at about 1780 K from the ground and separated by about 4 K), while levels for J = 1–0 v = 2 are 1780 K more energetic than for the v = 1 and J = 1–0 v = 3, which still requires an additional 1780 K.
On the other hand, maps of v = 1 J = 1–0 and J = 2–1 in the S-type star χ Cyg show relatively similar distributions (Soria-Ruiz et al. 2004); we note that the chemistry of S-type stars is expected to be different than for the usual O-rich stars with a lower H2O abundance in particular (see Alcolea et al. 2013), and, therefore, less efficient overlap effects. Remarkably, the v = 2 J = 2–1 and J = 1–0 maps in this source are significantly more compact (Soria-Ruiz et al. 2004; Cotton et al. 2010), but the maps show just a few spots in general and the results are not conclusive.
3.1. Calculations of the SiO v = 1, v = 2, and v = 3 maser pumping in the presence of line overlap
We have developed a theoretical model that calculates the emissivity and excitation of the SiO maser lines in the circumstellar envelope of an AGB star. Our code is similar to the one presented by Soria-Ruiz et al. (2004) but includes the SiO rotational transitions in the v = 3 vibrational state. In particular, the excitation of SiO is calculated under the LVG approximation, which approximately takes the maser effects into account even in the case of saturated masers. This theoretical approach can be used when there is a large velocity gradient in the masing region, and therefore, points that are separated a certain distance do not interact radiatively, resulting in a considerable simplification of the calculations. The inversion of the level populations in the maser transitions is due to the photon self-trapping in the Δv = 1 ro-vibrational transitions when these lines are opaque (see Kwan & Scoville 1974). When this is the case, the main de-excitation path for SiO molecules in the v ≥ 1 levels is spontaneous decay via Δv = 1 transitions. If the opacity is sufficiently large, the escape probability in the envelope is given by the inverse of the opacity for the corresponding transition, which is proportional to the J quantum number of the upper state. The higher the value of J, the more difficult for an SiO molecule to de-excite via Δv = 1 transitions, which results in a chain of masers along the corresponding vibrationally excited state. This inversion mechanism only operates when the pumping rate is independent of the J value, which is expected for collisional excitations and for radiative ones but only when they are optically thin. Therefore, radiative models must include optically thin Δv = 1 excitation and optically thick de-excitation ro-vibrational transitions at the same time. This a priori contradiction is solved by assuming a large velocity gradient or a geometry in which the masers arise from a thin spherical layer of the envelope, which are expected properties in inner circumstellar shells. If this is satisfied, the radial opacity in the Δv = 1 transitions is low, whereas the overall opacity (averaged in all directions) is high. The calculations we show here are performed under conditions leading to radiatively excited masers, for which the effects of line overlap are generally more important (see Bujarrabal et al. 1996; Soria-Ruiz et al. 2004). We recall that the goal of our paper is to show that line overlap can explain the observed spatial distributions of the different masing lines, which not a complete description of the line overlap effects for all possible physical conditions and the corresponding pumping properties. Because of the nature of the inversion mechanism, the physical conditions required by SiO masers within the same vibrational state (rotational lines; J = 1–0 at 43 GHz, J = 2–1 at 86 GHz, etc.) are similar in either radiative or collisional theoretical models. However, this is not the case for masers in different vibrationally excited states (v = 1, v = 2, v = 3 etc.), where the conditions must be naturally different, since it is difficult to have similar opacities for the Δv = 1 ro-vibrational transitions of levels with different excitations in a given shell of the envelope.
As mentioned in previous sections, Soria-Ruiz et al. (2004) showed that the observed relative location of the SiO masing regions was not reproduced by any of the radiative or collisional model, but may be explained by introducing the effects of the line overlaps between ro-vibrational transitions of 28SiO and H2O. This alternative mechanism was first proposed by Olofsson et al. (1981) to explain the anomalous weakness of the v = 2 J = 2–1 SiO maser in O-rich stars and its relatively high intensity in S-type stars. In particular, this was explained by invoking the overlap between the v = 1, J = 0–v = 2, J = 1 line of 28SiO and the v2 = 0–1 JKa,Kc=127,5–116,6 line of para-H2O, which are two lines with frequencies coincident down to a fraction equivalent to less than 1 km s-1.
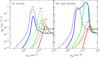 |
Fig. 4 Effects of the SiO-H2O line overlap on the excitation of the SiO maser emission for the three first vibrationally excited levels, v = 1, v = 2, v = 3 (blue, green and red respectively) J = 1–0 (solid lines) and J = 2–1 (dashed lines). The number of emitted photons (s-1 cm-3) in the maser transitions as a function of H2 density is shown. Left panel: model calculations that do not include the effects of the line overlap. Right panel: model results including the line overlap. |
This phenomenon was studied in more detail by Bujarrabal et al. (1996), who found that, the observed properties of the v = 2 J = 2–1 maser of 28SiO in both O-rich and S-type stars could be explained by introducing this line overlap in the model calculations. The line overlap efficiently affects the SiO masers because emission dominates absorption in the H2O line under expected conditions, which leads to a relative increase of the radiation available at the frequency of both vibrational transitions and a net increase of the number of photons absorbed by the v = 1, J = 0–v = 2, J = 1 SiO line (with respect to the case in which line overlap is not considered). Accordingly, a significant relative overpopulation of the v = 2 J = 1 level is produced in O-rich stars and the v = 2 J = 2–1 population inversion is quenched. As mentioned, this phenomenon also affects the excitation conditions of other lines, introducing a strong coupling between both v = 1, v = 2, J = 1–0 masers, since there is significant population transfer between the v = 1, J = 0 and the v = 2, J = 1 levels. For more details on how the line overlaps affect the pumping and level populations for these transitions, see Bujarrabal et al. (1996); Soria-Ruiz et al. (2004).
We have performed new calculations, including predictions of the v = 3, J = 1–0 intensity, which are summarized in Fig. 4. We represent the number of photons emitted by each maser line per cubic centimeter, and second, this parameter has been calculated for different values of the local density. As discussed by Soria-Ruiz et al. (2004), the variations of the local density can be interpreted as variations of the distance to the central star, for simplified assumptions on the matter distribution in the inner circumstellar shells, the higher densities appear in general closer to the star. Of course, the exact equivalence between density and distance to the stellar surface is very difficult to determine, and here, we only discuss qualitatively the relative spatial separation of the different maser lines. It is obvious that the local clumpiness also affects the observed brightness distribution, which is mostly in the case of these high-amplification masers that also amplify the local variations of the density. This yields the well known sharp distribution of the emission in many independent spots. For the case in which overlap is not considered (see Fig. 4 left) the lines within a given vibrational state appear under basically the same conditions. On the contrary, lines of different v-states require significantly different conditions, as expected in view of the very different excitation energies; for instance, much higher densities (i.e., shorter distances to the star) are required for v = 3 lines. Similar conclusions can be obtained from other published calculations independent of whether the pumping is dominantly radiative or collisional (e.g., Bujarrabal & Rieu 1981; Lockett & Elitzur 1992). However, line overlap effects couple the excitation of the v = 1 and 2 J = 1–0 lines, which present their maxima almost under the same conditions. Moreover, the densities required to pump both lines are now higher than that in the standard case, which neglects line overlap, and is quite close to the densities at which v = 3 J = 1–0 is intense. These results are compatible with the observations; three 43 GHz (J = 1–0) lines appear almost at the same distance from the star and are significantly closer (higher densities) than the 86 GHz line (v = 1 J = 2–1). Even the small (marginally detected) differences found between the ring structures of the three J = 1–0 lines (i.e. the v = 3 one being closer than v = 2 J = 1–0, which itself is slightly closer than v = 1 J = 1–0) are compatible with the slight difference in the intensity peak position that is predicted by the model calculations (with v = 3 J = 1–0 requiring slightly more density, etc.).
4. Conclusions
We have observed the VLBA four AGB stars, R Leo, TX Cam, U Her, and IK Tau, and obtained reliable maps of J = 1–0 SiO masers in the first three vibrationally excited states (v = 1, v = 2, and v = 3) toward the four sources. We find that the spatial brightness distribution of the v = 3 maser does not show significant differences with respect to those of the v = 1 and v = 2 lines. The v = 3 maser emission is distributed in a ring-like pattern and is coincident or slightly inner than those of v = 1, v = 2 J = 1–0. Despite our initial expectation, this agrees with model predictions and can be easily explained by the range of physical conditions that give rise to the v = 1, v = 2, v = 3 maser lines, which are predicted when the effects of the overlapping of two IR lines of SiO and H2O are taken into account (Sect. 3).
When line overlap is not taken into account, the observed distributions of the SiO maser lines cannot be explained by current models invoking either collisional or radiative maser pumping. The excitation conditions are very different for lines within the different vibrationally excited states (v = 1, v = 2, and v = 3), which are separated by an energy equivalent to almost 1800 K. On the other hand, the conditions required to excite the v = 1 J = 1–0 and J = 2–1 lines are almost the same, since the energy levels are separated by a few degrees. Since standard inversion schemes do not significantly discriminate the low-J levels, we expect, clearly different spot distributions for the masers in different v-states and very similar distributions for masers in the same state under both collisional or radiative pumping mechanisms.
However, the overlap of the above mentioned IR lines significantly affects the pumping of the v = 1, v = 2 J = 1–0: our calculations show that these two masers are then strongly coupled and require higher excitation conditions, which is similar to those of the v = 3 lines (which are not significantly affected by the line overlap); see details in Sect. 3. Therefore, the v = 1, v = 2, v = 3 J = 1–0 lines require quite similar excitation conditions and should appear in practically the same circumstellar shells due to the overlap effects. However, the v = 1 J = 2–1 maser, which is practically not affected by the considered pair of IR lines, requires lower excitation condition, and should appear in outer shells. Under the physical conditions adopted in our models we stress that the pumping of the SiO masers is mainly radiative and, indeed, that the effects of line overlap tend to be more important in the radiative pumping regime than for the collisional one. However, we cannot rule out that collisional models, includes the effects of line overlap, could also explain the relative spatial distributions of the different maser lines.
The predictions presented here are, therefore, compatible with the existing maps of these four maser lines, notably for J = 1–0 presented in this work and for our previous v = 1 J = 2–1 maps (Soria-Ruiz et al. 2004, 2005, 2007). Even the small (but systematic) differences found between the radii at which the three J = 1–0 maser emissions appear in the maps are qualitatively compatible with the model predictions.
In this paper, v = 1, v = 2, v = 3 refers to masers at the v = 1, v = 2, or v = 3 states.
The National Radio Astronomy Observatory is a facility of the National Science Foundation operated under cooperative agreement by Associated Universities, Inc
ODRpack is a collection of Fortran subprograms that can be freely downloaded from http://www.netlib.org/odrpack/readme
Acknowledgments
This work has made use of the databases of SIMBAD (http://simbad.u-strasbg.fr) and the AAVSO (http://http://www.aavso.org).
References
- Alcolea, J., Bujarrabal, V., & Gallego, J. D. 1989, A&A, 211, 187 [NASA ADS] [Google Scholar]
- Alcolea, J., Bujarrabal, V., Planesas, P., et al. 2013, A&A, 559, A93 [NASA ADS] [CrossRef] [EDP Sciences] [Google Scholar]
- Bujarrabal, V. 1994, A&A, 285, 953 [NASA ADS] [Google Scholar]
- Bujarrabal, V., & Nguyen-Q-Rieu 1981, A&A, 102, 65 [NASA ADS] [Google Scholar]
- Bujarrabal, V., Alcolea, J., Sanchez Contreras, C., & Colomer, F. 1996, A&A, 314, 883 [NASA ADS] [Google Scholar]
- Cotton, W. D., Vlemmings, W., Mennesson, et al. 2006, A&A, 456, 339 [NASA ADS] [CrossRef] [EDP Sciences] [Google Scholar]
- Cotton, W. D., Ragland, S., Pluzhnik, E. A., et al. 2010, ApJS, 188, 506 [NASA ADS] [CrossRef] [Google Scholar]
- Desmurs, J.-F., Bujarrabal, V., Colomer, F., & Alcolea, J. 2000, A&A, 360, 189 [NASA ADS] [Google Scholar]
- Diamond, P. J., Kemball, A. J., Junor, W., et al. 1994, ApJ, 430, L61 [NASA ADS] [CrossRef] [Google Scholar]
- Humphreys, E. M. L., Gray, M. D., Yates, J. A., et al. 2002, A&A, 386, 256 [NASA ADS] [CrossRef] [EDP Sciences] [Google Scholar]
- Imai, H., Nakashima, J. I, Deguchi, S. Yamauchi, et al. 2010, PASJ, 62, 431 [NASA ADS] [Google Scholar]
- Imai, H., Oyadomari, M., Chong, S. N., et al. 2012, PASJ, 64, L6 [NASA ADS] [Google Scholar]
- Kwan, J., & Scoville, N. 1974, ApJ, 194, L97 [NASA ADS] [CrossRef] [Google Scholar]
- Lockett, P., & Elitzur, M. 1992, ApJ, 399, 704 [NASA ADS] [CrossRef] [Google Scholar]
- Olofsson, H., Hjalmarson, A., & Rydbeck, O. E. H. 1981, A&A, 100, 300 [Google Scholar]
- Soria-Ruiz, R., Alcolea, J., Colomer, F., et al. 2004, A&A, 426, 131 [NASA ADS] [CrossRef] [EDP Sciences] [Google Scholar]
- Soria-Ruiz, R., Colomer, F., Alcolea, J., et al. 2005, A&A, 432, L39 [NASA ADS] [CrossRef] [EDP Sciences] [Google Scholar]
- Soria-Ruiz, R., Colomer, F., Alcolea, J., et al. 2007, A&A, 468, L1 [NASA ADS] [CrossRef] [EDP Sciences] [Google Scholar]
All Tables
Summary of the mean radius and width (in mas) obtained for the three transitions 28SiO v = 1, v = 2, v = 3, J = 1–0 by fitting a ring-like brightness distribution to the observed emission using the regression package ODRpack.
All Figures
|
Fig. 1 Single-dish spectra of the SiO J = 1–0 v = 3 maser emission from the AGB stars, R Leo (November, 2009), TX Cam (January, 2010), U Her (April, 2011), and IK Tau (October, 2011). The intensity scale is in Jy. |
| In the text | |
|
Fig. 2 Flux variation intensity (in Jy) with time (phase of the variability cycle of the source) from our monitoring with the Onsala telescope, of v = 1, v = 2, v = 3 (respectively blue cross, green plus and red square, triangles denote upper limits detection) for the sources detected more often than in two epochs in v = 3 J = 1–0. See observing dates in Table 3. |
| In the text | |
|
Fig. 3 VLBA maps of SiO J = 1–0 v = 1 (in blue), v = 2 (in green), and v = 3 (in red) maser emissions from R Leo (upper left, November 13, 2009), TX Cam (upper right, January 31, 2010), U Her (lower left, April 17, 2011), and IK Tau (lower right, November 04, 2011). To ease the comparison between the three maser lines, using the same color code, we plotted the fitting rings obtained with ODRpack for each maser transition (see Table 2). |
| In the text | |
|
Fig. 4 Effects of the SiO-H2O line overlap on the excitation of the SiO maser emission for the three first vibrationally excited levels, v = 1, v = 2, v = 3 (blue, green and red respectively) J = 1–0 (solid lines) and J = 2–1 (dashed lines). The number of emitted photons (s-1 cm-3) in the maser transitions as a function of H2 density is shown. Left panel: model calculations that do not include the effects of the line overlap. Right panel: model results including the line overlap. |
| In the text | |
Current usage metrics show cumulative count of Article Views (full-text article views including HTML views, PDF and ePub downloads, according to the available data) and Abstracts Views on Vision4Press platform.
Data correspond to usage on the plateform after 2015. The current usage metrics is available 48-96 hours after online publication and is updated daily on week days.
Initial download of the metrics may take a while.