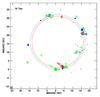
Fig. 3
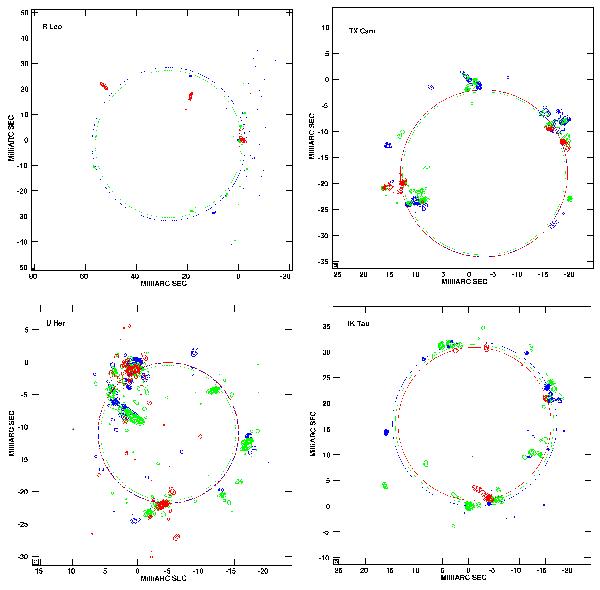
VLBA maps of SiO J = 1–0 v = 1 (in blue), v = 2 (in green), and v = 3 (in red) maser emissions from R Leo (upper left, November 13, 2009), TX Cam (upper right, January 31, 2010), U Her (lower left, April 17, 2011), and IK Tau (lower right, November 04, 2011). To ease the comparison between the three maser lines, using the same color code, we plotted the fitting rings obtained with ODRpack for each maser transition (see Table 2).
Current usage metrics show cumulative count of Article Views (full-text article views including HTML views, PDF and ePub downloads, according to the available data) and Abstracts Views on Vision4Press platform.
Data correspond to usage on the plateform after 2015. The current usage metrics is available 48-96 hours after online publication and is updated daily on week days.
Initial download of the metrics may take a while.