Fig. 7
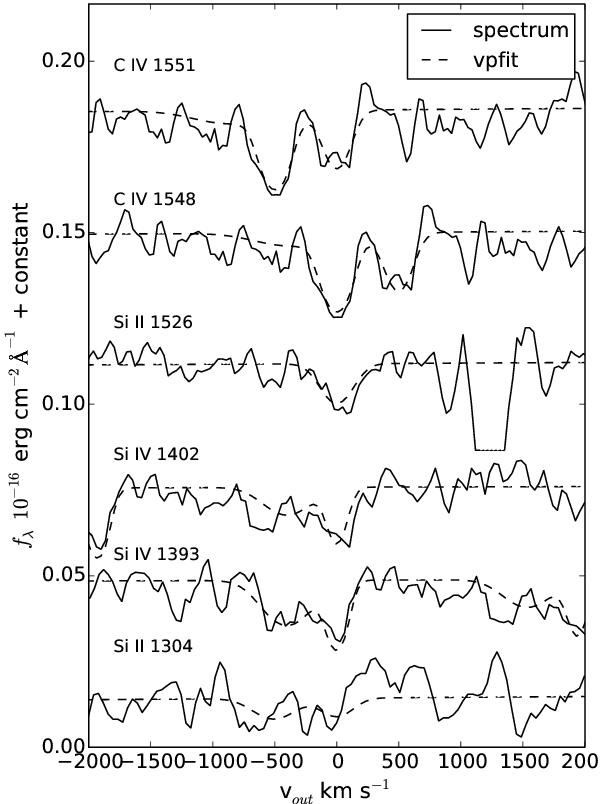
Line profile fitting for the spectrum of galaxy 30555, obtained with the vpfit code. The solid line represents the spectrum, which has been smoothed with a box function of 3 pixels wide for illustrative purposes. The dotted line is the fit from vpfit. The horizontal axis is the velocity, where a velocity of 0 is the centre of the rest-frame feature calculated with vpfit, and the vertical axis is the flux plus a constant. The absorption at ~500 km s-1 in the Si ii λ1304 Å line is due to absorption of O iλ1302 Å.
Current usage metrics show cumulative count of Article Views (full-text article views including HTML views, PDF and ePub downloads, according to the available data) and Abstracts Views on Vision4Press platform.
Data correspond to usage on the plateform after 2015. The current usage metrics is available 48-96 hours after online publication and is updated daily on week days.
Initial download of the metrics may take a while.