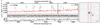
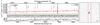
Fig. 2
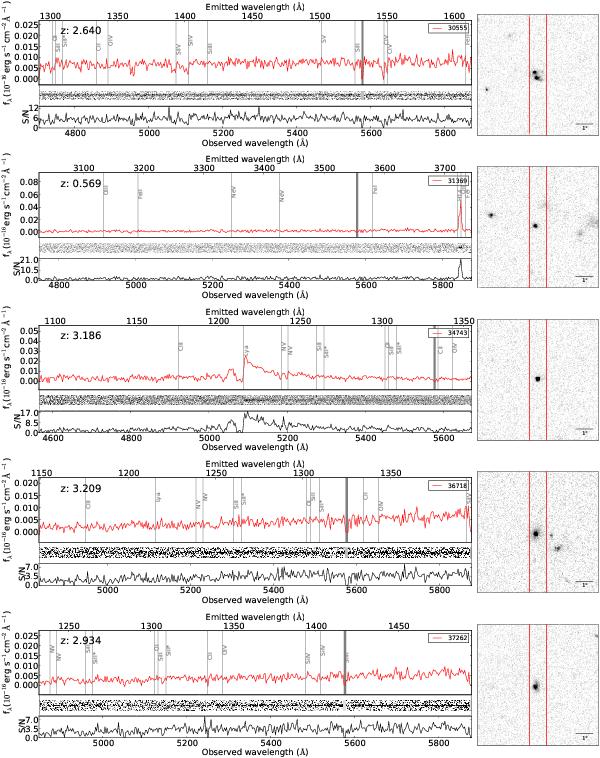
Rebinned spectra of targets in mask 1 with redshift determinations. The spectra are rebinned by a factor of 4 for illustrative purposes. The top spectrum is the reduced spectrum, where the top axis is rest-frame wavelength, the bottom axis the observed wavelength, and the vertical axis is the observed flux density. The determined redshift is shown in the top left corner, and the grey lines represent absorption and emission lines observed in other studies. Between 5575 Å and 5580 Å a poorly subtracted skyline is present (marked by the grey region), where we set the spectrum to 0. The absorption features seen at this wavelength are therefore artificial. The middle plot shows the high-resolution 2D spectrum, where we subtracted the sky as explained in the text. The bottom plot shows the S/N of every wavelength element, and the panel on the right is the 7″ × 7″ HST ACS WFC3 stamp in the F606W filter.
Current usage metrics show cumulative count of Article Views (full-text article views including HTML views, PDF and ePub downloads, according to the available data) and Abstracts Views on Vision4Press platform.
Data correspond to usage on the plateform after 2015. The current usage metrics is available 48-96 hours after online publication and is updated daily on week days.
Initial download of the metrics may take a while.