Fig. 11
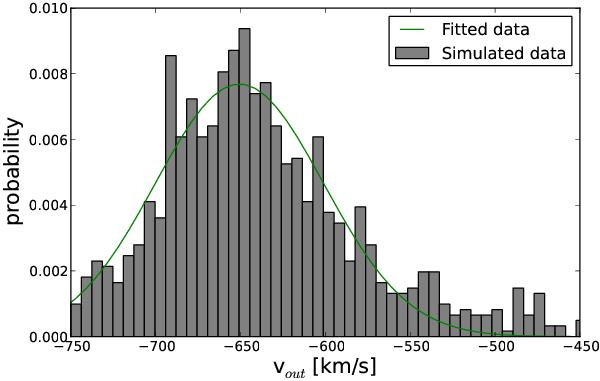
Distribution of outflow velocities for 1000 simulated spectra based on the spectrum of galaxy 34743. The solid line represents a Gaussian fit to the resulting distribution. To obtain the final error on galaxy velocity outflow, we considered the r.m.s. of this distribution, and added an extra error component taking into account the spectral resolution.
Current usage metrics show cumulative count of Article Views (full-text article views including HTML views, PDF and ePub downloads, according to the available data) and Abstracts Views on Vision4Press platform.
Data correspond to usage on the plateform after 2015. The current usage metrics is available 48-96 hours after online publication and is updated daily on week days.
Initial download of the metrics may take a while.