| Issue |
A&A
Volume 565, May 2014
|
|
|---|---|---|
| Article Number | A8 | |
| Number of page(s) | 17 | |
| Section | Galactic structure, stellar clusters and populations | |
| DOI | https://doi.org/10.1051/0004-6361/201323081 | |
| Published online | 21 April 2014 | |
Strömgren and near-infrared photometry of metal-rich bulge globular clusters
I. NGC 6528 and its surrounding field⋆,⋆⋆,⋆⋆⋆
1
Space Telescope Science Institute,
3700 San Martin Drive,
Baltimore,
MD
21218,
USA
e-mail:
This email address is being protected from spambots. You need JavaScript enabled to view it.
2
INAF – Osservatorio Astronomico di Roma, via Frascati 33,
00040
Monte Porzio Catone,
Italy
3
Università di Roma Tor Vergata, via della Ricerca Scientifica 1, 00133
Rome,
Italy
4
Dipartimento di Fisica e Astronomia, Università di
Bologna, viale Berti Pichat,
6/2, 40127
Bologna,
Italy
5
Research School of Astronomy and Astrophysics, The Australian
National University, Cotter Road,
ACT 2611, Weston,
Australia
6
INAF - Osservatorio Astronomico di Collurania,
64100
Teramo,
Italy
7
ESO Chile, Santiago, 19001 Casilla, Chile
8
Instituto de Astronomía, Universidad Católica del Norte,
Av 0610 Angamos,
Antofagasta,
Chile
9
Universidad de Concepción, 403-0576
Concepción,
Chile
10
Pontificia Universidad Católica de Chile,
Av. Vicuna Mackenna 4860, 782-0436
Macul, Santiago,
Chile
Received:
18
November
2013
Accepted:
2
February
2014
Abstract
We present Strömgren and near-infrared (NIR) photometry of the bulge cluster NGC 6528 and its surrounding field in Baade’s Window. uvby images were collected with EFOSC2 on the New Technology Telescope (NTT, La Silla, ESO). The NIR catalogs are based on J,K-band VIRCAM at VISTA (Paranal, ESO) and SOFI at NTT photometry. We matched the aforementioned data sets with Hubble Space Telescope photometry to obtain proper-motion-cleaned samples of NGC 6528 and bulge stars. Furthermore, we were able to correct the Strömgren-NIR photometry for differential reddening. The huge color sensitivity of the Strömgren-NIR color–magnitude-diagrams (CMDs) helped us in separating age and metallicity effects. The red giant branch (RGB) of NGC 6528 is well reproduced in all the CMDs by adopting scaled solar isochrones with solar abundance, that is Z = 0.0198, or α-enhanced isochrones with the same iron content, that is Z = 0.04, and an age range of t = 10–12 Gyr. The same isochrones well reproduce most of the color spread of Baade’s Window RGB. These findings support the literature age estimates for NGC 6528. We also performed a new theoretical visual-NIR metallicity calibration based on the Strömgren index m1 and on visual–NIR colors for red giant (RG) stars. Scaled solar and α-enhanced models were adopted and we validated the new metallicity-index-color (MIC) relations by applying them to estimate the photometric metal abundance of a sample of field RGs and of a metal-poor (M 92, [Fe/H] ~−2.3) and a metal-rich (NGC 6624, [Fe/H] ~ −0.7) globular cluster. We applied the calibration to estimate the mean metal abundance of NGC 6528, finding [Fe/H] = [M/H] = −0.04 ± 0.02, with a mean intrinsic dispersion of σ = 0.27 dex, by averaging the metallicities obtained with the scaled solar [m], y − J and [m], y − K MIC relations, and of −0.11 ± 0.01, with σ = 0.27 dex, by using the m1, y − J and m1, y − K relations. These findings support results based on high-resolution spectroscopy, which approximately give a solar metallicity for NGC 6528 with a modest α-enhancement. By applying the scaled solar MIC relations to the sample of Baade’s Window RGs, we find a metallicity distribution that extends approximately from [Fe/H] ~ −1.0 up to [Fe/H] ~ 1 dex, with two metallicity peaks at [Fe/H] ≈ −0.2 and [Fe/H] ≈ 0.55 ([m] , y − J and [m] , y − K relations), and [Fe/H] ≈ −0.25 and [Fe/H] ≈ 0.4 (m1, y − J and m1, y − K relations). These findings fairly agree with previous spectroscopic studies for Baade’s Window and the recent results of the ARGOS surveys for the bulge.
Key words: stars: abundances / Hertzsprung-Russell and C-M diagrams / Galaxy: bulge / stars: Population II / stars: evolution
Based on observations collected with EFOSC2 at the New Technology Telescope (ESO, program ID:085.D-0374).
Table 1 is available in electronic form at http://www.aanda.org
Strömgren photometry for NGC 6528 is only available at the CDS via anonymous ftp to cdsarc.u-strasbg.fr (130.79.128.5) or via http://cdsarc.u-strasbg.fr/viz-bin/qcat?J/A+A/565/A8
© ESO, 2014
1. Introduction
The study of the Galactic bulge is fundamental for understanding the star formation history of the Galaxy. Moreover, the Milky Way bulge is the closest galaxy bulge that can be observed, and constraining its properties is of great help for studying more distant galaxies. The Galactic bulge is, indeed, dominated by metal-rich old stars (t > 10 Gyr, Zoccali et al. 2003), but the presence of a few intermediate-age stars is not excluded (van Loon et al. 2003; Bensby et al. 2013). The metallicity distribution of red giant (RG) stars in the bulge spans a range from [Fe/H] ≈ −1.5 to 0.5, according to high-resolution spectroscopy of ~800 stars (Hill et al. 2011; Zoccali et al. 2008, hereafter ZO08). Furthermore, dating back to McWilliam & Rich (1994), there is also evidence that bulge stars are α-enhanced when compared with disk stars. This finding was further supported by the spectroscopic studies of Fulbright et al. (2007), concerning Baade’s Window, and more recently of Gonzalez et al. (2011), Rich et al. (2012), and Johnson et al. (2013), for stars covering a significant portion of the bulge. Moreover, there is evidence that the α-enhancement decreases at higher metallicities.
More recently, the Abundances and Radial velocity Galactic Origins Survey (ARGOS) provided medium-resolution spectroscopy for ~25 000 red clump stars distributed in 28 two-degree fields at different Galactic longitudes and for latitudes b = −5, −7.5, −10°. They found that the bulge stellar content consists of two spatially and chemically distinct subpopulations. a) A thin more metal-rich sub-sample that peaks at super-solar iron abundance ([Fe/H] ≈ 0.15) and is kinematically colder and closer to the Galactic plane. This component is associated with the thin disk of the Galaxy. b) A thick more metal-poor sub-sample (peaking at [Fe/H] ≈ −0.25) that is uniformly distributed across the selected fields. This component is associated with the boxy/peanut bulge (Ness et al. 2013a). They also identified a main more metal-poor component at [Fe/H] = −0.66 and two other peaks in their metallicity distribution function (MDF) at [Fe/H] = −1.16, and −1.73, which appear to be associated with the thick disk and with the inner halo (Freeman et al. 2013; Ness et al. 2013a). These results also agree with the high-resolution spectroscopy of a sample of 58 micro-lensed bulge dwarfs by Bensby et al. (2013). Their MDF presents three main bumps at [Fe/H] ≈ −0.7, −0.25, and 0.3, which agree with the three main populations identified by the ARGOS survey. These MDFs agree quite well with the results by Hill et al. (2011) for Baade’s Window (BW). These authors found a bi-modal metallicity distribution with peaks at [Fe/H] ~ −0.3 and 0.3, by using high-resolution spectra for 219 bulge red clump giants. The two main components seem to show different kinematical properties, with the most metal-poor stars more similar to an old-spheroid, while the metal-rich component resembles a bar population. A double peaked MDF was also found by Uttenthaler et al. (2012) based on medium-resolution spectra of ~400 RGs in a bulge field centered on (l,b) = (0°, −10°). The two peaks are located at [M/H] ~ −0.6 and ~0.3, suggesting that their metal-poor metallicity peak is shifted towards the more metal-poor regime when compared to the metal-poor peaks found by Bensby et al. (2011) and Hill et al. (2011). Moreover, Uttenthaler et al. (2012) also found that the metal-rich stars show a lower velocity dispersion than metal-poor stars. On the basis of this evidence they suggested that the metal-rich population, which makes ≈30% of the sample, belong to the bar, while the metal-poor one might belong to the Galactic bulge.
A quantitative explanation of how the Galactic bulge formed is still lacking, and medium- and high-resolution spectroscopic studies trace different regions of the bulge. Some evidence indicates that one can constrain the Milky Way bulge as a classical bulge, others favors a pseudo-bulge. The fact that the RR Lyrae do not show evidence of a bar is also suggests that the truly old (horizontal branch stars) bulge population forms a spherical bulge, while the intermediate-age population (red clump stars) form a boxy/peanut bulge (Vásquez et al. 2013; Dékány et al. 2013).
In this context, an interesting region to constrain the bulge nature is the BW. It is characterized by a low reddening, E(B − V) < 0.6 mag, and by the presence of two Galactic globular clusters (GGCs), namely NGC 6522 and NGC 6528. The former is classified as a metal-intermediate bulge cluster ([Fe/H] ~ −1.3/−1.2 dex). Calamida et al. (2011) estimated a mean metal-abundance of [Fe/H] = − 1.0 for this cluster by adopting a Strömgren theoretical metallicity calibration based on the hk index. The latter – NGC 6528 – is among the most metal-rich GGCs. Recent spectroscopic investigations based on high-resolution spectra suggested for this cluster a solar metallicity and a modest α-enhancement. Carretta et al. (2001) used four red horizontal-branch (RHB) stars and found [Fe/H] = 0.07 ± 0.01 and an α-enhancement of [α/Fe] ≈ 0.2, while Zoccali et al. (2004) used three RGB stars found [Fe/H] = 0.1 ± 0.2 and [α/Fe] = 0.1 ± 0.1. More recently, using high-resolution NIR spectra of four bright giants, Origlia et al. (2005) found [Fe/H] = 0.17 ± 0.01 and a higher α-enhancement, [α/Fe] = 0.33 ± 0.01. These measurements indicate that NGC 6528 is an ideal laboratory not only for constraining the α-enhancement in old metal-rich systems, but also for sheding new light on the possible occurrence of an age-metallicity relation among the most metal-rich Galactic globulars (Rakos & Schombert 2005; Dotter et al. 2011).
The metallicity estimates, based on photometric indices of field and cluster stars in the bulge, are to a limited degree hampered by the occurrence of differential reddening across the field of view and by the mix of stellar populations belonging to the bulge, the thick and thin disk, and to globulars. The first problem can be overcome by using NIR bands, but the latter is more complex. The use of optical-NIR color–color planes, in particular Strömgren-NIR planes, to separate cluster and field stars (Calamida et al. 2009; Bono et al. 2010) is limited because the metallicity distributions of bulge, thick, thin disk, and NGC 6528 all peak around solar chemical composition. Furthermore, the use of the color–color plane to separate field and cluster stars does require precise and deep photometry in at least three optical-NIR bands.
In the current paper we adopt ground-based photometry and use the Strömgren-NIR color–color planes to perform a preliminary selection of bulge, disk, and cluster stars. We also take advantage of optical and NIR space photometry collected with the Advanced Camera for Surveys (ACS) and the Wide Field Camera 3 (WFC3) on board the Hubble Space Telescope (HST) to estimate proper motions and additionally select the different stellar components. The ground-based Strömgren-NIR photometry was then adopted to estimate the metallicity distribution of bulge and cluster RGs by applying a new theoretical calibration of the Strömgren m1 = (v − b) − (b − y) metallicity index, based on visual-NIR colors.
This is the first paper of a series devoted to Strömgren-NIR photometry of metal-rich GGCs. In this initial investigation, we derive and test a new theoretical calibration of the m1 index, based on visual-NIR colors for RG stars. The new calibration is adopted to constrain the metallicity distribution of NGC 6528 and its surrounding field.
We adopted visual-NIR colors to derive metallicity-index-color (MIC) relations, since they have two clear advantages over indices only based on Strömgren colors. a) They are not hampered by CN, CH, and NH molecular absorption bands. Two strong CN bands (λ = 4142 and λ = 4215 Å) affect the v filter, while the strong CH-band at λ = 4300 Å might affect the v, b, and the NH-band at λ = 3360 Å and the two CN bands at λ = 3590 and λ = 3883 Å might affect the u filter. b) They are more sensitive to effective temperature. These molecular bands still affect the new visual-NIR MIC relations, but only through the Strömgren m1 index.
The new MIC relations are based on scaled solar and α-enhanced evolutionary models. The adopted evolutionary models were transformed into the observational plane by adopting bolometric corrections and color-temperature transformations based on atmosphere models constructed from the same chemical mixtures. They are valid in the metallicity range −2.5 < [Fe /H] < 0.5. The new MIC relations were validated by estimating the abundances of GGCs from the very metal-poor M 92 ([Fe/H] ~ −2.3) to the metal-rich bulge cluster NGC 6624 ([Fe/H] ~ −0.6), and of field RG stars, and by comparing them with medium- and high-resolution spectroscopic measurements.
The structure of the paper is as follows: in Sect. 2 we discuss the observations and data reduction in detail, while in Sect. 3 we describe the photometric calibration. In Sect. 4 we present the Strömgren-NIR catalogs. Section 5 deals with the approach adopted for calibrating the visual-NIR MIC relations for giant stars, while in Sect. 6 we present the different tests validating the theoretical MIC relations together with the comparison of photometric estimates and spectroscopic measurements of metal abundances. In Sect. 7 we study the metallicity distribution of NGC 6528 and Baade’s Window RGs. A summary of the results and a brief discussion of future developments of the new MIC relations are given in Sect. 8.
2. Observations and data reduction
We adopted Strömgren photometry of the bulge cluster NGC 6528 collected with the EFOSC2 camera on the NTT in 2010 (program ID: 085.D-0374). The CCD is a loral/lesser thinned AR coated 2048 × 2048 chip with a pixel size of 15 μm, corresponding to a pixel scale of 0.̋12. The field of view (FoV) is thus 4.1′× 4.1′. We used the normal read-out mode and the 2 × 2 binning, which results in an effective pixel scale of 0.̋24.
We collected 2u-, 2v-, 3b- and 3y-band images during two different nights (July 11 and 13), with exposure times ranging from 60 to 2500 s and seeing from 0.̋7 to 1.̋0. The total FoV is ≈5′× 5′and includes the cluster center. The footprints of the observed fields are shown in Fig. 1 (blue), while the log of the observations is given in Table 1.
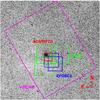 |
Fig. 1 Footprints of the different optical-NIR data sets for the bulge cluster NGC 6528 and its surrounding field. |
Halo clusters for which we have published Strömgren photometry (Grundahl et al. 2000, 2002; Calamida et al. 2007, hereafter CA07) were observed during the same nights with similar airmass conditions. The purpose was to adopt cluster stars as a set of standards to derive calibration curves for the observing nights. These will then be applied to calibrate the photometry of bulge clusters observed soon after or before the calibrating clusters. To calibrate the photometry of NGC 6528 we observed NGC 6752 during the same nights, collecting 6u-, 6v-, 6b- and 6y-band images for a total FoV of ≈4′× 4′centered on the cluster. These observations overlap with the FoV of our published photometry for NGC 6752, which will be later adopted to calibrate the data set. The log of NGC 6752 observations is also shown in Table 1.
Raw images were pre-processed by using tasks available in the IRAF data analysis environment for bias subtraction and flat-fielding. To flat-field these data we adopted median sky flats collected during the three observing nights. The photometry was performed using DAOPHOTIV/ALLSTAR and ALLFRAME (Stetson 1987, 1991, 1994). We first estimated an analytical point-spread function (PSF) for each frame by selecting bright, isolated stars, uniformly distributed on the chip. A Moffat analytical function quadratically variable on the chip was assumed for the PSF. We performed PSF analytical photometry on each image with the task ALLSTAR. In order to obtain a global star catalog for each cluster and each night, we used the task DAOMATCH/DAOMASTER (Stetson 1994) and then performed simultaneous PSF-fitting photometry with the task ALLFRAME. The final star catalogs of the two nights of observations of NGC 6528 include ≈22 000 (July 11) and ≈10 000 stars (July 13), with a measure in at least two bands.
The NIR photometry of NGC 6528 is from Son of ISAAC (SOFI) on NTT and VIRCAM on the Visible and Infrared Survey Telescope for Astronomy (VISTA, Paranal, ESO). The SOFI data set consists of 111 J-, 12 H- and 111 Ks-band images (see the green footprints in Fig. 1). The images were pre-reduced with a specific IRAF task pipeline kindly provided by M. Dall’Ora. As for EFOSC2, the photometry of the SOFI images was carried out with DAOPHOTIV/ALLSTAR. A single list of improved positions and instrumental magnitudes for the stars located in overlapping fields was obtained by using DAOMATCH/DAOMASTER.
The VISTA Variables in the Vía Lácteà (VVV) Survey (Minniti et al. 2010; Catelan et al. 2011) is one of six ESO Public Surveys operating on VISTA, scanning the Galactic bulge (−10 ≤ l ≤ + 10, −10 ≤ b ≤ + 5) and the adjacent part of the southern disk (−65 ≤ l ≤ −10, −2 ≤ b ≤ + 2). The survey collects data in five NIR bands (YZJHKs) with the VIRCAM camera (Emerson et al. 2010), an array of sixteen 2048 × 2048 pixel detectors with a pixel scale of 0.̋341. The VVV images extend several magnitudes fainter than the Two Micron All Sky Survey (2MASS, Skrutskie et al. 2006), and have an increased spatial resolution (Saito et al. 2012). Both of these factors are particularly important for mitigating contaminated photometry in crowded regions such as the cores of globular clusters. We retrieved from the Vista Science Archive website1 VVV images containing NGC 6528 for a total FoV of 17′× 22′ (see purple footprint in Fig. 1). We also retrieved data for NGC 6624, a cluster adopted later to test the validity of metallicity calibrations. Data were pre-reduced at the Cambridge Astronomical Survey Unit (CASU)2 with the VIRCAM pipeline (Irwin et al. 2004). We then performed PSF-fitting photometry by using the VVV-SkZ_pipeline code (Mauro et al. 2013) on the single 2048 × 2048 pixel chips extracted from the stacked VVV pawprints (Saito et al. 2012). A quadratically variable Moffat function with β = 3.5 was adopted in this case to perform the PSF-fitting photometry on the VIRCAM images.
3. Photometric calibration
3.1. EFOSC2 data set
We first applied aperture corrections to the single cluster instrumental photometric catalogs. The corrections were estimated for the adopted reference y,b,v,u-band images and then applied to the mean magnitudes. Photometry was also corrected for exposure times and airmass values of the reference images by adopting the standard La Silla extinction coefficients for the Strömgren filters.
The two corrected instrumental catalogs of NGC 6752 for the nights July 11 and 13 were
cross-correlated with the calibrated Strömgren catalog for this cluster. We obtained a
sample of ≈5000 and
≈1500 stars in common for
the two nights, respectively, to estimate the calibration curves. The stars were selected
in photometric accuracy, σy,b,v,u<
0.1 mag, and the cluster center was excluded by keeping stars with a
distance from the cluster center larger than 1.5′. The derived calibration curves for the two nights are
 where
i stands
for instrumental magnitude.
where
i stands
for instrumental magnitude.
We applied these calibration curves to the NGC 6528 corrected instrumental photometry for the nights of July 11 and 13. We then merged the two data sets, obtaining a final calibrated catalog of 22 986 stars.
The typical accuracy of the absolute zero-point calibration is ~0.06 mag for the u-band data and ~0.05 mag for the v,b, y-band data.
3.2. SOFI and VIRCAM data sets
The NIR broad-band filters J,H,KS, with which the SOFI images were collected, have passbands very similar to those used for the observations of the 2MASS survey (Cutri et al. 2003). Therefore, after the aperture corrections were computed for the PSF stars in each single frame by using DAOGROW (Stetson 1990), the instrumental magnitudes were calibrated to the 2MASS system using a set of local standards. The solutions of the calibration equations were found with CCDSTD (Stetson 1993). We obtained a catalog of ~65 000 stars, with at least one measurement in two bands. The photometric catalog ranges from the tip of the RGB to ~0.5–1 mag below the main sequence turn-off (MSTO).
The VIRCAM photometric catalog was also tied to the 2MASS system. The calibration consisted of applying the classical correction for the zero point and color terms to the ALLFRAME output. The procedure has already been described by Moni Bidin et al. (2011); Chene et al. (2012); Mauro et al. (2013). The VVV-SkZ_pipeline was fundamental because it is the only photometric procedure for VVV data that is able to provide accurate photometry even for partially saturated stars. The H2MASS-band photometry (hereafter H2MASS = H,J2MASS = J,Ks2MASS = K) was neglected, since the precision in this filter was too poor at the limiting magnitudes we are dealing with.
The SOFI and VIRCAM catalogs were matched and we estimated the weighted mean of the J- and K-band magnitudes. The final merged NIR catalog includes ≈50 000 stars with an accuracy of ≈0.05 mag at J ≈ 19 mag and covers a FoV of ≈8′× 8′.
4. Strömgren-NIR photometry
4.1. NGC 6528
The Strömgren photometry of NGC 6528 was cross-correlated with the NIR photometry and we obtained with a Strömgren-NIR catalog of 22 025 stars. This catalog was then matched to optical and NIR photometry collected with ACS and WFC3 on board the HST (program IDs: GO9453, GO11664). We refere to LA14 for details on this data set observations and reduction techniques. The final merged catalog includes 3189 stars and covers a FoV of ≈2.2′× 2.2′, with the cluster center located in the north-east corner (see red footprint in Fig. 1). We corrected the photometry for differential extinction by adopting the individual reddening values estimated for each star in the field by LA14.
We then adopted the proper-motion selection of LA14 to obtain a clean sample of 737 cluster stars with a measurement in at least two Strömgren and two NIR bands. The matched catalog reaches 1 mag below the turn-off (TO) with an accuracy of ≈0.2 mag at y ≈ 21.5 mag.
We also matched current NGC 6528 photometry with the high-resolution spectroscopic targets reported by Zoccali et al. (2004, hereafter ZO04, ZO08) and Origlia et al. (2005) and the reported CaT spectroscopy by Saviane et al. (2012, hereafter SA12). The three RGs in the ZO04 sample are located inside our FoV, namely OGLE 357459, OGLE 357480 and I 42, while only one out of the four RGs in the Origlia et al. sample (star 3167) is covered by our catalog. Star OGLE 357480 has a color systematically bluer than cluster RGs and it does not belong to NGC 6528 according to our proper-motion selection; the same outcome applies to star 3167. We ignored both of them. Six stars of the SA12 sample were found in common with our Strömgren-NIR photometry. One star, R1-42, is star I 42 of the ZO04 sample, and the other five, R2-8, R2-41, 1_3704, 1_1044 and 1_2735, belong to NGC 6528 according to current proper-motion selection. We obtained seven candidate cluster member RGs with spectroscopic abundance measurements available.
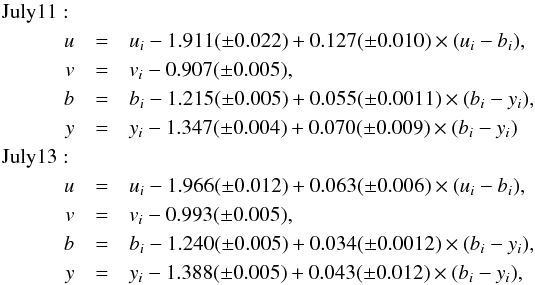
Figure 2 shows the y,y − J, b,b − J, and v,v − J proper-motion cleaned color-magnitude diagram (CMD) of NGC 6528. Stars were selected according to the separation index3 by keeping the best 90% of the stars for each 0.18 magnitude bin in the ranges 15.5 <y< 22, 16.7 <b< 23.1, and 18.5<v<24.3 mag. We excluded the u-band since the photometry is based on only one image per night and it is not accurate enough for this study.
We adopt three different CMDs because from the empirical point of view, different Strömgren-NIR bands have different photometric accuracy. Moreover, from the theoretical point of view, the color-temperature relations (CTRs) adopted to transform isochrones into the observational plane need to be tested. This is the first time, indeed, that these models were adopted to fit the entire magnitude range from the MS to the RGB in Strömgren-NIR CMDs.
The lines in Fig. 2 show isochrones for different ages and different chemical composition, namely Z = 0.0198, Y = 0.273, scaled solar, t = 12 (red solid line) and t = 10 Gyr (blue dotted), and Z = 0.04, Y = 0.303, α-enhanced ([α/Fe] = 0.4), t = 12 (green dashed) and t = 10 Gyr (purple dotted-dashed). The corresponding scaled solar and α-enhanced zero age horizontal branches (ZAHBs, red and green lines) for Z = 0.0198 and Z = 0.04 are also plotted. The adopted chemical compositions have the same iron content, [Fe/H] ~ 0.06, but different helium and α-element abundances. Isochrones and ZAHBs are from the BASTI data base (Pietrinferni et al. 2004, 2006, hereafter PI06) and evolutionary prescriptions were transformed into the observational plane by using atmosphere models computed assuming scaled solar and α-enhanced chemical mixtures. We adopted a true distance modulus of DM0 = 14.50 mag (LA14), and a mean reddening of E(B − V) = 0.54 mag for NGC 6528. The reddening was estimated as a weighted mean of the values given by the extinction map of Gonzalez et al. (2011) for this FoV and by adopting a standard reddening law, RV = AV/E(B − V) = 3.1. The extinction coefficients are then estimated by applying the Cardelli et al. (1989) reddening relations, finding Ay = AV, Ab = 1.225 × AV, Av = 1.424 × AV, and E(y − J) = 2.23 × E(B − V) mag, E(b − J) = 2.91 × E(B − V) mag, and E(v − J) = 3.527 × E(B − V) mag.
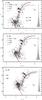 |
Fig. 2 y,y − J (top), b,b − J (middle), v,v − J (bottom) CMDs of NGC 6528. Stars were selected according to proper motions and photometric accuracy and were corrected for differential reddening. The red solid and green dashed lines display cluster isochrones at fixed age but different chemical compositions. The blue dotted and purple dotted-dashed lines display younger isochrones for the same chemical compositions (see labeled values). The cluster isochrones are based on evolutionary models computed by assuming either a scaled solar (s-s, red solid and blue dotted) or an α-enhanced (α-e) chemical mixture (green dashed and purple dotted-dashed). Orange and cyan filled dots mark RGs with spectroscopic abundances from ZO04 and SA12, respectively. The two horizontal arrows mark the location of the RHB (brighter) and of the RGB bump (fainter), while the right bent arrow shows the reddening vector. The adopted true distance modulus, mean reddening and error bars are labeled. |
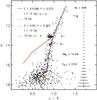 |
Fig. 3 K,J − K CMD of NGC 6528. Stars were selected according to proper motions and photometric accuracy and corrected for differential reddening. Symbols and lines are the same as in Fig. 2. |
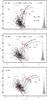 |
Fig. 4 Same as Fig. 2, but for the field surrounding NGC 6528. Stars were selected according to proper motions and photometric accuracy and corrected for differential reddening. Symbols and lines are the same as in Fig. 2. |
Data plotted in Fig. 2 show a clean sample of NGC 6528 member stars corrected for differential reddening down to 1 mag below the TO. Unfortunately, the precision of both Strömgren and NIR photometry (see the error bars in Fig. 2), and the residual uncorrected reddening do not allow us to properly identify the cluster MSTO. However, evolved evolutionary features can be easily identified in the three CMDs. The RGB bump is identified as an overdensity at y ~ 17.8 and y − J ~ 3 mag, b ~ 17.8 and b − J ~ 4 mag and v ~ 20.5 and v − J ~ 5.7 mag (see the arrows in Fig. 2). The RHB is well separated from the RGB and is located at y ~ 17 and y − J ~ 3, b ~ 18 and b − J ~ 4 mag and v ~ 19.5 and v − J ~ 5.5 mag (see the arrows). The scaled solar models (red solid and blue dotted lines) fit the observations quite well within the uncertainties and suggest for this cluster an age of 11 ± 1 Gyr. Interestingly enough, stars from the spectroscopic samples agree quite well with scaled solar isochrones in the three CMDs. The α-enhanced isochrones (green dashed and purple dotted-dashed) attain, as expected, systematically redder colors in the three CMDs. However, the difference in color and magnitude between the two different sets does not allow us to reach firm conclusions concerning the cluster α-enhancement. But the observed RGB bump stars appear to be systematically bluer than predicted by the α-enhanced isochrones.
We plot the same candidate cluster stars in the NIR K,J − K CMD in Fig. 3. In this plane the RHB and the RGB bump are much better defined (see arrows). The same isochrones and ZAHBs of Fig. 2 are overplotted by adopting the same reddening and distance modulus. It is worth noting how the isochrones overlap along the MS and the RGB phases in the K,J − K CMD, while at fixed iron abundance, the α-enhanced models are redder than the scaled solar models in the Strömgren-NIR CMDs (see Fig. 2). Figure 3 shows that α-enhanced and scaled solar isochrones agree quite well within the uncertainties (see error bars in the figure) with NIR observations, confirming an age of 11 ± 1 Gyr for the cluster. This result agrees very well with the age derived by Feltzing & Johnson (2002) for NGC 6528, that is 11 ± 2 Gyr. They adopted F555W,F814W WFPC2 photometry and astrometry to obtain a proper-motion cleaned CMD for the cluster. To fit the optical CMD they used α-enhanced isochrones reported by Salasnich et al. (2000) for Z = 0.04, a distance modulus of DM0 = 14.29 mag and reddening E(B − V) = 0.54 mag. Moreover, current estimates also agree well with the results of Momany et al. (2003). They presented NIR photometry of NGC 6528 based on SOFI data – which are included in our data set – and cluster members were selected by adopting HST proper motions. They estimated a cluster age of 12.6 Gyr by adopting the Bertelli et al. (1994) scaled solar isochrones for Z = 0.02 and a distance modulus DM0 = 14.44 mag and E(B − V) = 0.55 mag. Finally, our age estimate agrees very well with the results of LA14 who find t = 11 ± 1 Gyr by fitting their optical HST CMD with a scaled solar isochrone with [Fe/H] = 0.20 (Dell’Omodarme et al. 2012) and by adopting DM0 = 14.50 mag and E(B − V) = 0.56 mag.
4.2. Field surrounding NGC 6528
A clean proper-motion sample of 986 candidate bulge stars was selected from the Strömgren-NIR catalog and is plotted on the y,y − J, b,b − J, and v,v − J CMDs in Fig. 4. In the comparison between theory and observations we adopted the same theoretical framework, reddening, and absolute distance modulus as for NGC 6528. Figure 4 shows that we do not have enough statistics to properly characterize the bulge stellar populations in Baade’s Window. However, data plotted in the Strömgren-NIR CMDs highlight several interesting features.
-
a)
The RGB shows a clear dispersion in color in all the CMDs,mostly caused by both a metallicity and an age spread. Indeed, the adopted isochrones do not bracket the color dispersion along theRGB. Together with the above intrinsic properties, the colordispersion is also caused by the effect of residual uncorrected differential reddening (see the arrows in Fig. 4 for the reddening direction), by depth effects, and by photometricerrors. The current data set does not allow us to separate these degeneracies.
-
b)
The RHB is a poorly sequence and red clump (RC) stars are overlapping the RGB.
-
c)
The RGB bump is only moderately visible, except for a small overdensity of stars ranging from 19.5 ≲ v ≲ 21 mag and 5 ≲ v − J ≲ 6.5 mag in the v,v − J CMD.
-
d)
There is a weak residual contamination by disk stars located in a sequence brighter and bluer than the MSTO in all the CMDs.
Data plotted in Fig. 4 show that a fraction of observed stars along the MS and the RGB are systematically redder and/or fainter than predicted by adopted cluster isochrones. This result suggests the possible occurrence of large samples of super metal-rich stars, [Fe/H] > 0.1, in Baade’s Window. However, these objects might also be explained with an increase either in the mean reddening or in depth, or both.
4.3. RC-RHB stars and the RGB bump
To shed new light on this interesting open problem, we plotted the entire selected VIRCAM-SOFI catalog in the K,J − K CMD in Fig. 5. The RC-RHB region and the RGB bump are much better defined than in Fig. 4 because of the increased statistics and the reduced sensitivity of NIR colors to effective temperature then in optical-NIR colors. The same isochrones as Fig. 4 are overplotted by adopting the same reddening and distance modulus. This figure shows that the adopted isochrones also agree well with the NIR observations of the bulge stars in Baade’s Window. In particular, the dispersion in color of the bulge MS is quite similar to the dispersion in color of the NGC 6528 CMD at the same magnitude level (see Fig. 3). This suggests that the spread in color is mainly caused by photometric errors and residual differential reddening.
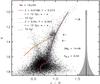 |
Fig. 5 Same as Fig. 3, but for the field surrounding NGC 6528. Stars were selected according to photometric accuracy only. Symbols and lines are the same as in Fig. 2. |
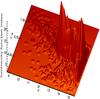 |
Fig. 6 3D K,J − K CMD of field stars surrounding NGC 6528, based on VIRCAM-SOFI photometry. The CMD is slightly rotated to better show the separation between blue MS and RG stars. At K = 14, MS stars cluster around J − K = 0.6, while RGs around J − K = 0.8 mag. |
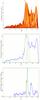 |
Fig. 7 Top: 2D K-band – based on VIRCAM-SOFI photometry – luminosity function of field RGs surrounding NGC 6528. Middle: projected K-band luminosity function of field RGs. The two Gaussian functions adopted to fit the RC-RHB regions are overplotted as red solid lines. The green line shows the cumulative fit. Bottom: projected K-band luminosity function of NGC 6528 RGs selected according to proper motions. Symbols and lines are the same as in the middle panel. |
However, data plotted in this figure show that the ZAHBs attain a K-band magnitude that is systematically fainter than observed RHB-RC stars. This is interesting empirical evidence. Indeed, current spectroscopic targets use RC stars as stellar tracers. The selection is performed using NIR CMDs and the region in color and in magnitude they adopt includes not only truly RHB (old (t > 10 Gyr), low-mass), but also truly RC (intermediate-age (t< 8 Gyr), intermediate-mass) stars. Note that this separation is far from being an academic debate and, indeed, according to current evolutionary prescriptions, in the former group the central helium-burning takes place in a more massive, electron-degenerate core, while in the latter it occurs in a less massive, partially electron-degenerate core (Fiorentino et al. 2012; Coppola et al. 2013).
This scenario does imply a difference in mean magnitude between the two groups, because RHB stars are in optical and in NIR magnitudes fainter and bluer than RC stars. To additionally constrain this effect we adopted the entire sample of VIRCAM-SOFI measurements to study the magnitude and color distribution of stars in the RHB-RC region. To avoid NGC 6528 we selected only stars with a distance from the cluster center larger than ≈2.5′. Figure 6 shows the 3D K,J − K CMD of candidate stars brighter than K = 15.5 mag. To select only RGs we then performed a color selection by excluding all stars bluer than J − K = 0.7 mag. Figure 7 (top panel) shows the 2D luminosity function of selected RGs. Central helium-burning stars (RC, RHB) display a double peak in the magnitude range 12.5 <K< 13.5 mag (red and blue arrows, respectively), while the RGB bump shows a well-defined peak at K = 13.90 ± 0.05 mag (green arrow). The middle panel of the same figure shows the projected K-band luminosity function of selected RG stars (blue solid line). We fit the RC-RHB region by using two Gaussian functions (red lines), finding the following peaks: K = 12.86 ± 0.02 mag (σ = 0.19 mag) and K = 13.25 ± 0.02 mag (σ = 0.16 mag). It is noteworthy that the fainter peak is also systematically bluer (J − K ≈ 0.9 mag) than the brighter one (J − K ≈ 1.0 mag, see Fig. 6). This suggests a clear separation in both magnitude and in color between the two peaks.
The bottom panel of Fig. 7 shows the same projected K-band luminosity function of bright (K ≳ 15.5 mag) proper-motion-selected RGs in NGC 6528. The RHB peaks at K ≈ 13.15 mag, while the RGB bump at K = 13.85 ± 0.05 mag. The RGB bump magnitude agrees very well with the bump luminosity found by Momany et al. (2003), K = 13.85 ± 0.05 mag, and by Ferraro et al. (2000), K ≈ 13.80 mag. We then performed a fit of the RHB region by adopting two Gaussian functions (red lines) with peaks at K = 13.16 ± 0.02 mag (σ = 0.08 mag) and K = 12.97 ± 0.02 mag (σ = 0.06). The secondary bright peak among cluster RGs might be due to minor residual contamination by field stars. Moreover, the faintest peak at K = 13.16 ± 0.02 mag agrees very well with K = 13.20 ± 0.05 mag found by Momany et al. (2003) for the RHB of NGC 6528.
These findings indicate that the fainter peak of field RG luminosity function at K = 13.25 mag might be associated with the RHB of the old stellar population, and the brighter peak at K = 12.86 mag to RC stars. Interestingly enough, the difference in magnitude between the RC and the RHB peak (ΔK ~ 0.4 mag) supports recent findings concerning the boxy/peanuts shape of the Galactic bulge (McWilliam & Zoccali 2010; Saito et al. 2011).
5. Calibration of new visual-NIR metallicity indices for giant stars
The calibration of Strömgren photometric indices to obtain stellar metal abundances is an established technique. Empirical calibrations based on this method have been made by Strömgren (1964), Bond (1970), Crawford (1975), Nissen (1981).
All the derived relations to estimate the metal abundance of RG stars are hampered by molecular CN, CH and NH-bands which affect the Strömgren uvb filters and in turn the global metallicity estimates. Moreover, most of the relations presented in the literature include the c1 index, which is based on the u filter. Observations in the u filter are very demanding concerning the telescope time, and the photometry in this band is less accurate because of the reduced CCD sensitivity in this wavelength region. For more information about the Strömgren photometric system and metallicity calibration see Calamida et al. (2007, 2012).
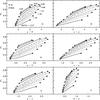 |
Fig. 8 Left panels: m1 vs. y − K plane (panel a)) for isochrones at fixed cluster age (t = 12 Gyr) and different global metallicities ([M/H], see labeled values). The evolutionary phases range from ≈the base (empty squares) to ≈the tip of the RGB (asterisks). Evolutionary tracks were computed by assuming a scaled solar chemical mixture and transformed into the observational plane by adopting atmosphere models computed assuming the same mixture. Panels b) and c) show similar relations, but in the m1 vs. y − H and in the m1 vs. y − J plane. Right panels: same as the left, but for the m1 vs. u − y (panel d)), m1 vs. v − y (panel e)), m1 vs. b − y (panel f)) planes. |
In Calamida et al. (2012) we derived for the first time a theoretical calibration of a metallicity diagnostic based on the m1 index and on visual-NIR colors for dwarf stars. We provide here a similar theoretical calibration based on the same colors, but for RG stars.
Independent MIC relations were derived using cluster isochrones based on both scaled solar and α-enhanced ([α/Fe] = 0.4) evolutionary models (PI06). Theoretical predictions were transformed into the observational plane by adopting bolometric corrections (BCs) and CTRs based on atmosphere models computed assuming the same heavy element abundances (PI06, Castelli & Kurucz 2006). The Vega flux was taken from Castelli & Kurucz (1994)4. The metallicities used for the calibration of the MIC relations are Z = 0.0001, 0.0003, 0.0006, 0.001, 0.002, 0.004, 0.01, 0.02 and 0.03. These Z values indicate the global abundance of heavy elements in the chemical mixture, with a solar metal abundance of (Z/X)⊙ = 0.0245. The corresponding iron content for the α-enhanced models can be obtained by using the relationship given by Salaris et al. (1993): [Fe/H] = [M/H] − log (0.638f + 0.362), where log (f) = [α/Fe] .
Figure 8 shows nine scaled solar isochrones plotted in different visual-NIR (left) and Strömgren (right) MIC planes. The J,H,K filters where transformed into the 2MASS photometric system by applying the color transformations by Carpenter et al. (2001). Panels a–c display the m1 index versus three visual-NIR colors (y − K, y − H, y − J), while the panels d–f show the m1 index versus three Strömgren colors (u − y, v − y, b − y). The evolutionary phases plotted in this figure range from approximately the base (open square) to the tip of the RGB (asterisk).
The two different sets of MIC relations cover similar m1 values but the visual-NIR colors – panels a–c – show a stronger sensitivity in the faint-magnitude limit and an almost linear change when moving from metal-poor to metal-rich stellar structures. The Strömgren colors – panels d–f – show a minimal sensitivity for stellar structures more metal-rich than [M/H] ≳ −0.25. Moreover and even more importantly, the slopes of the MIC relations based on visual-NIR colors are on average shallower than the MIC relations based on Strömgren colors. This means that the former indices have, at fixed m1 value, a stronger temperature sensitivity. We performed the same comparison with the α-enhanced models and obtained very similar results.
The MIC relations for RG stars based on Strömgren colors are affected by molecular bands, such as CN, CH, and NH. Indeed, two strong cyanogen molecular absorption bands are located at λ = 4142 and λ = 4215 Å, that is very close to the effective wavelength of the v filter (λeff = 4110, Δλ = 190 Å). Moreover, the strong CH molecular band located in the Fraunhofer’s G-band (λ = 4300 Å) might affect both the v and the b magnitude. It is noteworthy that the molecular NH band at λ = 3360 Å and the two CN bands at λ = 3590 and λ = 3883 Å might affect the u (λeff = 3450, Δλ = 300 Å) magnitude (see, e.g. Smith 1987). To decrease the contamination by molecular bands in the color index, we decided to adopt only colors based on the y-band and on the NIR bands in our new calibration of MIC relations. The main advantage of this approach is that the aforementioned molecular bands only affect the Strömgren m1 index.
We derived theoretical MIC relations based on m1 and the y-NIR colors based on 2MASS
J,H,K
filters. Together with the classical m1 index, we also computed independent MIC
relations for the reddening-free parameter [m] = m1 + 0.3 × (b–y
) to overcome deceptive uncertainties caused by differential reddening.
To select the m1 and the [m] values along the
individual isochrones we followed the same approach as adopted in CA07. A multilinear
regression fit was performed to estimate the coefficients of the MIC relations for the
m1
and the [m]
indices as a function of the three CIs, namely y − J,
y −
H and y − K:
![Mathematical equation: \begin{eqnarray*} m_1 &=& \alpha\, + \beta\,{\rm [M/H]} + \gamma\, CI + \delta\, CI^2 + \epsilon\, m_1^2 + \zeta\, (CI \times {\rm [M/H]}) \\ &&+ \eta\, (m_1 \times {\rm [M/H]}) + \theta\, (CI \times m_1) \\ &&+\iota\, (CI^2 \times m_1^2), \end{eqnarray*}](/articles/aa/full_html/2014/05/aa23081-13/aa23081-13-eq191.png) where
the symbols have their usual meaning. To select the form of the analytical relation we
followed the forms adopted for the m1 and the hk metallicity index
calibrations in CA07 and Calamida et al. (2011),
respectively. We performed several tests finding the best solution of the multilinear
regression fit when adopting the m1 index as an independent variable. We
then selected the solution with the lowest chi-square of the multilinear regression fit. As
an additional check, we estimated the root mean square (RMS) deviations of the fitted points
from the fit and the values range between 0.0005 to 0.0009. Moreover, the multicorrelation
parameters attain values close to 1. The coefficients of the fits together with their
uncertainties for the twelve MIC relations, are listed in Table 2. The RMS values and the multicorrelation parameters of the different
relations are listed in the last two columns of the table.
where
the symbols have their usual meaning. To select the form of the analytical relation we
followed the forms adopted for the m1 and the hk metallicity index
calibrations in CA07 and Calamida et al. (2011),
respectively. We performed several tests finding the best solution of the multilinear
regression fit when adopting the m1 index as an independent variable. We
then selected the solution with the lowest chi-square of the multilinear regression fit. As
an additional check, we estimated the root mean square (RMS) deviations of the fitted points
from the fit and the values range between 0.0005 to 0.0009. Moreover, the multicorrelation
parameters attain values close to 1. The coefficients of the fits together with their
uncertainties for the twelve MIC relations, are listed in Table 2. The RMS values and the multicorrelation parameters of the different
relations are listed in the last two columns of the table.
These MIC relations are valid in the following color ranges 0.05 <m1< 0.7 mag, 0.2 < [m] < 1.1 mag, 1.4 <y − J< 2.8 mag, 1.8 <y − H< 3.5 mag, and 1.9 <y − K< 3.7 mag for the scaled solar models, while they are valid in the color ranges 0.05 <m1< 0.6 mag, 0.2 < [m] < 0.9 mag, 1.5 <y − J< 2.7 mag, 2.0 <y − H< 3.5 mag, and 2.0 <y − K< 3.7 mag for the α-enhanced models.
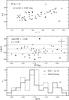 |
Fig. 9 a) Selected field RGs from the sample of ATT94/ATT98 plotted in the [m], y − J plane (Ns = 61, filled dots). b) Difference between photometric and spectroscopic metallicities, Δ [M/H] = [M/H] phot − [M/H] spec, plotted versus [M/H] spec for the 61 field RGs (filled dots). Photometric metallicities are based on the α-enhanced [m] , y − J MIC relation. c) Normalized photometric metallicity distribution for the 61 RGs obtained with the [m], y − J MIC relation (black solid line), compared with the normalized spectroscopic distribution (black dashed). |
6. Validation of the new metallicity calibration
6.1. Field red giant stars
To validate the new theoretical calibration of the m1 index based on visual-NIR colors we estimated the metallicity of field RGs for which uvby and NIR photometry and high-resolution spectroscopy are available. The Strömgren photometry and spectroscopy was taken from Anthony-Twarog & Twarog (1994, 1998, hereafter ATT94, ATT98), while NIR data were retrieved from the 2MASS archive (see CA07 for more details on the selection of this sample). The sample includes 81 field RGs with a measurement in the uvby and the J,H,K bands, a reddening estimate (ATT98) and high-resolution spectroscopy on the Zinn & West (1984) metallicity scale. For 28 RGs we retrieved5 the Calcium abundance from Fulbright (2000), from which a proxy of the α-enhancement was estimated, that is [α/Fe] ≈ [Ca/Fe]. We applied the α-enhanced calibration because we verified that it is best suited to estimate the photometric metallicity of halo field RGs (Calamida et al. 2012, CA07). The metallicity range covered by current α-enhanced MIC relations is −2.3 < [M/H] < 0.3, but we selected stars with −2.5 < [M /H] < 0.5 to account for current uncertainties in spectroscopic abundances and in the GC metallicity scale (Kraft & Ivans 2003). Furthermore, we selected the RGs in photometric accuracy, that is σJ,H,K< 0.05 mag, and according to the color range of validity of the six MIC relations, which yielded a sample of 61 stars, for 12 of which we have the [α/Fe] spectroscopic measurement.
To deredden the m1 index and the colors of the field RGs we adopted E(m1) = −0.30 × E(b–y ) (CA07) and E(y − J) = 2.23 × E(B − V), E(y − H) = 2.56 × E(B − V), E(y − K) = 2.75 × E(B − V), estimated assuming the Cardelli et al. (1989) reddening relation and RV = AV/E(B − V) = 3.1.
Multilinear regression coefficients for the Strömgren metallicity index:
![Mathematical equation: \hbox{$m_1 = \alpha\, + \beta\,[{\rm Fe/H]} + \gamma\, {\rm CI} + \delta\, CI^2 + \epsilon\,m_1^2 + \zeta\, ({\rm CI} \times [{\rm Fe/H}]) + \eta\, (m_1 \times [{\rm Fe/H]}) + \theta\, ({\rm CI} \times m_1) + \iota\, (CI^2 \times m_1^2)$}](/articles/aa/full_html/2014/05/aa23081-13/aa23081-13-eq214.png) .
.
The selected stars are plotted in the [m] , y − J plane in panel a of Fig. 9 (filled dots). The star marked with an asterisk is HD 84903, which might be affected by weak chromospheric emission in the core of the Ca II K line (ATT98). For this star we adopted the spectroscopic measurement reported by Thèvenin & Idiart (1999), estimated by accounting for non-LTE effects (Calamida et al. 2011). The diamond marks a CH-strong star, HD 55496 (ATT98, CA07). Panel b of the same figure shows the difference between the photometric and the spectroscopic metallicity (Δ [M/H] = ( [M/H] phot − [M/H] spec)) for the 61 field RG stars as a function of their spectroscopic metal abundances ([M/H]spec). We assumed an α-enhancement of [α/Fe] = 0.4 and estimated [M/H]spec = [Fe/H]spec + log (0.638 × f + 0.362), where log (f) = [α/Fe] for stars with no α-element abundance measurement. The observed dispersion is mainly caused by photometric, reddening, and spectroscopic errors. The error bars in panel b display the mean error for the spectroscopic abundance measurements (see ATT98 and CA07 for more details on how the errors are estimated). Data plotted in panel b show that on average there seems to be a shift of photometric metal abundances towards metal-poor values. Photometric metallicities were estimated by adopting the [m] , y − J MIC relation and the mean difference between photometric and spectroscopic measurements is − 0.08 ± 0.10 dex, with a mean intrinsic dispersion of σ = 0.29 dex. The CH-strong star (diamond) shows a much higher photometric metallicity (Δ [M/H] = [M/H] phot − [M/H] spec = 0.6), as expected (CA07). The difference between photometric and spectroscopic measurements derived by averaging the MIC relations based on the reddening-free metallicity indices ([m] , y − J, [m] , y − H, [m] , y − K) is − 0.13 ± 0.06 dex. Similar results are obtained when applying the other MIC relations, and the mean difference derived averaging the m1, y − J, m1, y − H, m1, y − K relations is −0.16 ± 0.05 dex. In spite of this systematic small shift towards metal-poor values, the average intrinsic dispersions are σ = 0.25 and σ = 0.24 dex, respectively. Moreover, the shape of the photometric metallicity distribution estimated by adopting the [m ] , y − J relation agrees quite well within the uncertainties with the shape of the spectroscopic one (see the solid and dashed lines in panel c). A similar agreement between photometric and spectroscopic metallicity distributions is obtained when applying the other MIC relations.
The culprit for the systematic shift between photometric and spectroscopic abundances might be that α-enhancement for field stars is lower than the assumed α value. The evolutionary models adopted to perform our theoretical metallicity calibration were computed assuming [α/Fe] = 0.4. This is the typical enhancement found in cluster stars using high-resolution spectra (Kraft 1994; Gratton et al. 2004). Unfortunately, we do not have an α-enhancement abundance measurement for our field star sample, but only an estimate of the α-enhancement proxy, that is [α/Fe] ≈ [Ca/Fe], for 12 out of the 61 RGs, with a median value of [α/Fe] = 0.35, and a dispersion of 0.08 dex. It is worth mentioning that we found a similar shift, ≈−0.1 dex, when we adopted the visual-NIR α-enhanced MIC relations to estimate photometric metallicities of field dwarfs in Calamida et al. (2012). When we assumed an α-enhancement of 0.2 for the stars without the [α/Fe] spectroscopic estimate, we found a very good agreement between spectroscopic and photometric abundance estimates. We obtained a mean difference of 0.04 ± 0.05 dex, with a mean intrinsic dispersion of σ = 0.30 dex ([m] , y − J, [m] , y − H, [m] , y − K) and 0.00 ± 0.05 dex, with σ = 0.30 dex ( m1, y − J, m1, y − H, m1, y − K). On the other hand, when we adopted the scaled solar calibration to estimate the abundance of the same sample we obtained photometric metallicities systematically more metal-poor than the spectroscopic abundances, with a mean difference of −0.19 ± 0.04 and a mean dispersion of σ = 0.26 dex for the [m], CI relations, while a mean difference of −0.24 ± 0.02 and a mean dispersion of σ = 0.21 dex for the m1, CI relations.
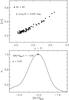 |
Fig. 10 Top: selected RG stars of the GGC M 92 plotted in the [m], y–K plane. Bottom: photometric metallicity distribution obtained by applying the [m], y − K MIC relation for the sample 83 RG stars. |
6.2. Cluster red giant stars
To additionally validate the new theoretical visual-NIR metallicity calibration, we also adopted the photometry of a metal-poor halo GGC, M 92 (NGC 6341, [Fe/H] = −2.35 ± 0.05, Carretta et al. 2009) and of a metal-rich bulge cluster, NGC 6624 ([Fe/H] = −0.69 ± 0.02, Valenti et al. 2011).
Using cluster data brings three indisputable advantages:
-
a)
The evolutionary status (age, effective temperature, surface gravity, stellar mass) of cluster RGs is clearly established.
-
b)
The abundance of iron and α-elements is known with high precision.
-
c)
The selected clusters cover a broad range in iron abundance.
Data for NGC 6624 were collected with EFOSC2 during July 12 and 13 2010. We have u-, 8v-, 6b-, and 4y-band images, with exposure times ranging between 40 to 380 s and seeing between 1.̋0 to 1.̋5. The total FoV is 4.6′× 4.6′ and includes the cluster center. We followed the same approach as adopted for NGC 6528 in reducing and calibrating the data, and obtained a catalog of 6217 stars. These data were matched with NIR VIRCAM photometry, yielding an optical-NIR catalog of 4252 stars.
The Strömgren catalog of M 92 was obtained with images collected with the 2.56 m Nordic Optical Telescope (NOT) on La Palma (for more details see Grundahl et al. 2000, CA07). We cross-correlated the Strömgren photometry of M 92 with the NIR photometry of Valenti et al. (2004a) for the RGs in this cluster, and obtained a sample of 340 stars that had a measurement in the u,v,b,y and J,K bands. We then adopted the b − J,y − K color–color plane to separate the M 92 RGs from field stars as described in CA07, obtaining a clean cluster sample of 223 stars. We applied the same procedure to separate NGC 6624 RGs from field stars, which yielded a sample of 147 RGs for this cluster.
The top panel of Fig. 10 shows M 92 candidate member RGs selected in photometric accuracy, that is σv,b,y,K< 0.025 mag, and plotted in the [m] , y − K plane. We adopted E(B − V) = 0.02 mag for M 92 (Di Cecco et al. 2010) and the relations derived in Sect. 5 to deredden the cluster photometry. The bottom panel shows the metallicity distribution obtained for the 86 RGs by adopting the [m], y − Kα-enhanced MIC relation. The distribution was smoothed by applying a Gaussian kernel with a standard deviation equal to the photometric error in the m1 index, following the prescriptions of Calamida et al. (2009, 2012). The distribution has a quite symmetric shape, and most of the spread is due to photometric errors. The residual spread is caused by the effect of CN/CH/NH molecular bands on the m1 index; M 92 shows the typical variations in [C/Fe] and [N/Fe] (Langer et al. 1986; Bellman et al. 2001) together with the typical anticorrelations of most GGCs (Pilachowski et al. 1983; Sneden et al. 1991; Kraft 1994). We also found a similar effect when applying the visual-NIR metallicity calibration to M 92 MS stars (Calamida et al. 2012).
By fitting M 92 metallicity distribution with a Gaussian we obtained a main peak at [M/H] = −2.02 ([Fe/H] = −2.37) with a dispersion of σ = 0.20 dex. The metallicity distributions obtained by applying the other MIC relations agree with each other with averaged mean peaks of −2.05 ± 0.04 ([Fe/H] = − 2.40) and a mean intrinsic dispersion of σ = 0.31 dex ([m], y − J, [m], y − K relations), and of −2.07 ± 0.01 ([Fe/H] = − 2.42), with σ = 0.25 dex (m1, y − J, m1, y − K relations). These estimates agree well within the uncertainties with spectroscopic estimates from the literature ([Fe/H] = −2.24 ± 0.10, Zinn & West 1984, and [Fe/H] = −2.35 ± 0.05, Carretta et al. 2009). On the other hand, when we applied the scaled solar MIC relations to estimate the iron abundance of M 92, we obtained a mean peak of [Fe/H] = −2.17 ± 0.01, and a mean intrinsic dispersion of σ = 0.24 dex ([m] , y − J, [m] , y − K relations), and of −2.15 ± 0.02, with σ = 0.40 dex (m1, y − J, m1, y − K relations). These values are on average slightly (~0.1 dex) more metal-rich than the spectroscopic values.
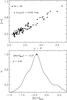 |
Fig. 11 Top: selected RGs of the bulge cluster NGC 6624 plotted in the [m], y − K plane. Bottom: photometric metallicity distribution obtained by applying the [m], y − K MIC relation for the sample of 95 RGs. |
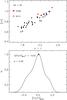 |
Fig. 12 Top: selected RGs of the bulge cluster NGC 6528 plotted in the [m], y − J plane. Bottom: photometric metallicity distribution obtained by applying the [m], y − J MIC relation for the sample of 40 RGs. Stars with spectroscopic measurements by ZO08 and SA12 are marked with filled red stars and open blue diamonds, respectively. |
Figure 11 shows the same test performed for NGC 6624. We adopted a reddening of E(B − V) = 0.28 mag for this cluster (Valenti et al. 2004a). The candidate RGs are clearly split into two sequences in the [m] , y − K plane (see top panel). The split is caused by the effect of the molecular bands, such as CN, CH and NH, on the m1 index, which is more pronounced in metal-rich clusters, as shown in CA07, and constrained by ACS-HST photometry in the case of NGC 1851 and 47 Tuc (Milone et al. 2008, 2012). This dichotomy in NGC 6624 has not yet been confirmed by spectroscopic studies.
The smoothed metallicity distribution obtained by applying the [m] , y − Kα-enhanced MIC relation is shown in the bottom panel of Fig. 11. The shape of the distribution is asymmetric, with a tail towards the metal-rich regime up to [M/H] ≈ 0.7, and a secondary peak at [M/H] ≈ 0.4. The metal-rich tail could be due to the residual contamination by field disk stars. Fitting the distribution with a single Gaussian we obtained a main peak at [M/H] = −0.37 ([Fe/H] = −0.72) with a dispersion of σ = 0.40 dex. Most of the dispersion is caused by photometric errors, but part of it is due to the uncorrected differential reddening and the rest is intrinsic, that is caused by CN- and CH-strong stars. The metallicity distributions obtained by applying the other MIC relations agree with each other with averaged mean peaks of − 0.39 ± 0.09 ([Fe/H] = − 0.74) and a mean intrinsic dispersion of σ = 0.42 dex ([m], y − J, [m], y − H, and [m], y − K relations), and of −0.40 ± 0.04 ([Fe/H] = −0.75), with σ = 0.42 dex (m1, y − J, m1, y − H, and m1, y − K relations). These estimates agree very well within the uncertainties with high-resolution spectroscopic estimates from Valenti et al. (2011), [Fe/H] = −0.69 ± 0.02, and with the CaT measurements of Heasley et al. (2000), [Fe/H] = −0.63 ± 0.09 and of Mauro et al. (2014), [Fe/H] = −0.67 ± 0.10. On the other hand, by applying the scaled solar metallicity relations to estimate the cluster iron abundance, we obtained an average mean peak of [Fe/H] = − 0.97 ± 0.03 and a mean intrinsic dispersion of σ = 0.28 dex ([m], y − J, [m], y − H, and [m], y − K relations), and of −0.99 ± 0.06, with σ = 0.34 dex (m1, y − J, m1, y − H, and m1, y − K relations). These iron abundances are almost 0.3 dex more metal-poor than the spectroscopic values.
Photometric and spectroscopic metallicities for four RG stars in the bulge cluster NGC 6528.
7. Metallicity of the bulge cluster NGC 6528 and its surrounding field
We adopted the new visual-NIR calibration to estimate the metal abundance of the bulge cluster NGC 6528 and to study the metallicity distribution of RGs in the surrounding field in Baade’s Window.
We selected 97 RG stars from the clean cluster sample shown in Fig. 2. Stars were also selected in photometric accuracy, that is σv,b,y,J,H,K ≤ 0.025 mag, separation index, sepv,b,y ≥ 5, and for the color ranges of validity of the calibration, which yielded a final sample of 40 NGC 6528 RGs. We adopted E(B − V) = 0.54 mag to un-redden the data (see Sect. 4). The top panel of Fig. 12 shows the selected stars plotted in the [m] , y − J plane. The two filled red stars mark RGs with high-resolution spectroscopic measurement from ZO08, the empty blue diamonds mark two RGs with CaT spectroscopic abundances from SA12. One star, I 42, belongs to both samples. Four stars from the sample of SA12 were rejected because they did not pass the selection in photometric accuracy or were outside the color range of validity of the calibration. The dispersion of the sequence in the [m] , y − J plane is mostly caused by photometric errors and possibly some residual uncorrected differential reddening. It is noteworthy that RGs are not split into two parallel sequences in this color–color plane, as in the case of NGC 6624. Unfortunately, we do not have enough statistics to ascertain whether the absence of the split is intrinsic or caused by the paucity of the sample. Nor we have enough spectroscopic data to constrain the effect of CN/CN/NH molecular bands on the broadening of the RG sequence in the [m] , y − J plane.
The smoothed metallicity distribution obtained by applying the scaled solar [m] , y − J MIC relation is shown in the bottom panel of Fig. 12. The shape of the distribution is quite similar to the shape of the metallicity distribution of NGC 6624, while the dispersion is much lower, σ = 0.19 dex compared with σ = 0.40 dex. Part of the difference might arise because NGC 6528 Strömgren-NIR catalog was corrected for differential reddening and cleaned from the contamination of field disk stars by using proper-motion measurements estimated with HST photometry, while the NGC 6624 catalog was cleaned from field contamination only by adopting the Strömgren-NIR color–color planes, and it was not corrected for differential reddening. The metal-rich tail in the NGC 6624 metallicity distribution is indeed absent from the NGC 6528 distribution, but the distribution does not look to be mono-parametric. Fitting NGC 6528 MDF with a single Gaussian, we obtained a main peak at [Fe/H] = −0.02 with a dispersion of σ = 0.19 dex by adopting the scaled solar [m] , y − J MIC relation. The metallicity distributions obtained by applying the other scaled solar MIC relations agree with each other, with average mean peaks of − 0.04 ± 0.02 and a mean intrinsic dispersion of σ = 0.27 dex ([m] , y − J and [m] , y − K relations), and of −0.11 ± 0.01, with σ = 0.27 dex (m1, y − J and m1, y − K relations). The photometric metallicity estimates for the four RGs with the corresponding spectroscopic measurements from ZO08 and SA12 are listed in Table 3 together with the spectroscopic measurement errors. For star I 42 we estimated α-enhancement as [α/Fe] = [Ca+ Mg + Si/Fe]. The reduced equivalent widths – W′ – from SA12 were converted in [Fe/H] measurements by adopting the relation presented in the paper (the interested reader is referred to SA12 for more details), and then converted to the Zinn & West (1984) metallicity scale by adopting the relation provided by Carretta et al. (2009). The agreement between photometric and spectroscopic estimates for the four RGs is very good within the uncertainties (see Table 3).
We also adopted the α-enhanced MIC relations to estimate the metallicities of NGC 6528 RGs but we obtained metal abundances that were too metal-rich by more than 0.5 dex, that is Δ [M/H] = [M/H] phot − [M/H] spec ≈ 0.5 dex.
We then studied the metallicity distribution of Baade’s Window by adopting our clean sample of bulge star. We selected RG stars from the sample shown in Fig. 4, and obtained 62 candidate bulge RGs. The stars were also selected according to photometric accuracy, that is σv,b,y,J,H,K ≤ 0.03 mag and separation index, sepv,b,y ≥ 0, and for the color ranges of validity of the calibration, which yielded a final sample of 56 RGs. The sample photometry was dereddened by using the same reddening as adopted for NGC 6528. The top panel of Fig. 13 shows the selected stars plotted in the [m] , y − J plane. The bottom panel of Fig. 13 displays the smoothed photometric metallicity distribution obtained by applying the scaled solar [m] , y − J MIC relation. The distribution is clearly bimodal, with a main peak at [Fe/H] ≈ − 0.25 and a secondary one at [Fe/H] ≈ 0.5. Similar distributions were obtained when adopting the other visual-NIR MIC relations, with average peaks at [Fe/H] ≈ − 0.2 and [Fe/H] ≈ 0.55 ([m] , y − J, [m] , y − H and m1, y − K relations), and [Fe/H] ≈ − 0.25 and [Fe/H] ≈ 0.4 (m1, y − J, m1, y − H, and m1, y − K relations). By applying the α-enhanced MIC relations, we obtained a metallicity distribution shifted by almost 1 dex towards the metal-rich regime.
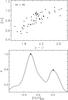 |
Fig. 13 Top: selected RGs of the field surrounding NGC 6528 in Baade’s Window plotted in the [m ] , y − J plane. Bottom: photometric metallicity distribution obtained by applying the [m] , y − J MIC relation to the sample of 56 Baade’s Window RGs. |
8. Summary and conclusions
We presented Strömgren-NIR photometry of the bulge globular cluster NGC 6528 and its surrounding field in Baade’s Window. The main findings derived from the Strömgren-NIR photometry of cluster and field stars are the following:
-
a)
The isochrone fit of the proper-motion-cleaned anddifferential-reddening-corrected Strömgren-NIR CMDs forNGC 6528 suggests an age of11 ± 1 Gyr, from adopting a scaled solar isochrone with solar abundance, that is Z = 0.0198, Y = 0.273, or a α-enhanced isochrone with the same iron content, that is Z = 0.04, Y = 0.303. The same scaled solar and α-enhanced isochrones agree quite well within the uncertainties with the NIR CMD of NGC 6528. This result iagrers well with the literature age estimates, that is t = 11 ± 2 Gyr (Feltzing & Johnson 2002), 12.6 Gyr (Momany et al. 2003), and 11 ± 1 Gyr (LA14).
-
b)
We adopted the same theoretical framework as was used for NGC 6528 to fit Strömgren -NIR CMDs of proper-motion-selected and differential-reddening-corrected bulge stars. We found that a fraction of observed stars along the MS and the RGB are systematically redder and/or fainter than predicted by adopted cluster isochrones. This result suggests the possible occurrence of large samples of super metal-rich stars, [Fe/H] > 0.1, in Baade’s Window. However, these objects might also be explained with an increase either in differential reddening or in depth, or both.
-
c)
We found that central helium-burning stars display a well-defined double-peak distribution. The fainter peak is located at K ~ 13.25 ± 0.02 and appears to be associated with the RHB stars, since the peak in the K-band luminosity function of cluster RGs is located at K ~ 13.16 ± 0.02 mag. The brighter (K ~ 12.86 ± 0.02) peak seems to be associated with intermediate-age RC stars. The two peaks also show a clear separation in color (RHB, J − K ~ 1.0; RC, J − K ~ 0.9). More quantitative constraints concerning the age and the metallicity distribution of the above evolutionary features do require detailed synthetic CMDs and luminosity functions (Calamida et al., in prep.).
Furthermore, we also provided a new theoretical metallicity calibration based on the m1 index and on visual-NIR colors to estimate the global metal abundance of cluster and field RG stars. We adopted scaled solar and α-enhanced evolutionary models. This is the first time that visual-NIR colors were dopted to estimate photometric metallicities of RG stars.
We validated the new theoretical metallicity calibration by adopting a sample of field RGs with Strömgren and NIR photometry and high-resolution spectroscopy available. The sample includes 61 RGs selected from the study by ATT94 and ATT98. The mean difference between photometric and spectroscopic abundance is −0.16 ± 0.05 dex, with a mean intrinsic dispersion of σ = 0.24 dex (m1, y − J, and, m1, y − K relations) and 0.13 ± 0.06 dex, with σ = 0.25 dex ([m] , y − J and [m] , y − K relations).
These independent comparisons indicate that the new theoretical MIC relations provide accurate metal abundances for field RG stars with a dispersion lower than 0.3 dex.
We also tested the calibration by adopting RG stars of two GGCs that cover a broad range in metal abundance, that is M 92 ([Fe/H] = − 2.31) and NGC 6624 ([Fe/H] = − 0.69), for which both Strömgren and NIR photometry were available.
We found that the metallicity distributions of M 92 based on the α-enhanced visual-NIR MIC relations agree very well with the spectroscopic estimates available in literature, that is [Fe/H] = −2.24±0.10 (Zinn & West 1984) and [Fe/H] = −2.35 ± 0.05 (Carretta et al. 2009). We found, indeed, a global metallicity of [M/H] = −2.05 ± 0.04 ([Fe/H] = − 2.40), with a mean intrinsic dispersion of σ = 0.31 dex, by averaging the values obtained by adopting the [m] , y − J and the [m] , y − K relations, and of −2.07 ± 0.01 ([Fe/H] = −2.42), with σ = 0.25 dex, by using the m1, y − J and m1, y − K relations.
By applying the α-enhanced visual–NIR MIC relations to the bulge cluster NGC 6624, we found averaged mean peaks of − 0.39 ± 0.09 ([Fe/H] = − 0.74) and a mean intrinsic dispersion of σ = 0.42 dex ([m] , y − J, [m] , y − H, and [m] , y − K relations), and of −0.40 ± 0.04 ([Fe/H] = −0.75) with σ = 0.42 dex (m1, y − J, m1, y − H, and m1, y − K relations). These estimates agree well within the uncertainties with spectroscopic estimates from the literature ([Fe/H] = −0.63 ± 0.09, Heasley et al. 2000, and [Fe/H] = − 0.69 ± 0.02, Valenti et al. 2011).
We also applied the new calibration to study the metallicity distribution of the bulge cluster NGC 6528 and its surrounding field. The smoothed metallicity distribution obtained by applying the scaled solar [m ] , y − J MIC relation to the proper-motion-selected and differential-reddening-corrected cluster RGs shows a main peak at [Fe/H] = −0.02, with a dispersion of σ = 0.19 dex. The metallicity distributions obtained by applying the other scaled solar MIC relations agree with each other, with average mean peaks of −0.04 ± 0.02 and a mean intrinsic dispersion of σ = 0.27 dex ([m] , y − J and [m] , y − K relations), and of −0.11 ± 0.01, with σ = 0.27 dex (m1, y − J and m1, y − K relations). The agreement between photometric and spectroscopic estimates for the four RGs in common with the spectroscopic samples of ZO04 and SA12 is very good within the uncertainties. By adopting the α-enhanced MIC relations to estimate the metallicities of NGC 6528 RGs, we obtained metal abundances that were too metal-rich by more than 0.5 dex, that is Δ [M / H] = [M/H] phot − [M/H] spec ≈ 0.5 dex. This result supports the spectroscopic measurements of ZO04 for NGC 6528, which give [Fe/H] = − 0.10 ± 0.2 and a low α-enhancement, i.e. [α/Fe] ≈ 0.1, and the findings of Carretta et al. (2001), which were based on high-resolution spectroscopy of RHB stars, which give [Fe/H] = 0.07 ± 0.01, with a modest α-enhancement, [α/Fe] ≈ 0.2.
The smoothed photometric metallicity distribution of proper-motion selected and differential reddening corrected RGs in Baade’s Window surrounding NGC 6528, based on scaled solar [m] , y − J MIC relation, is clearly bimodal, with a main peak at [Fe/H] ≈ −0.25 and a secondary one at [Fe/H] ≈ 0.5. Similar distributions are obtained when adopting the other visual-NIR MIC relations, with average peaks at [Fe/H] ≈ −0.2 and [Fe/H] ≈ 0.55 ([m] , y − J, [m] , y − H and m1, y − K relations), and [Fe/H] ≈ −0.25 and [Fe/H] ≈ 0.4 (m1, y − J, m1, y − H , and m1, y − K relations). By applying the α-enhanced MIC relations we obtain a metallicity distribution shifted by almost 1 dex towards the metal-rich regime.
The shape of our photometric metallicity distribution is quite similar to the shape of the spectroscopic distribution derived by ZO08 and Hill et al. (2011) based on a sample of ≈200 RGs in Baade’s Window. The metal-rich peak of the photometric distribution is slightly shifted (≈0.15–0.2 dex) towards the metal-rich regime. The shift might be caused by the effect of the molecular CN/CH/NH-bands on the m1 index, which would mean that the RGs appear to be more metal-rich than they really are. Moreover, our MIC relations are valid in the metallicity range − 2.3 < [Fe/H] < 0.3, and can be safely adopted in the range −2.5 < [Fe/H] < 0.5, taking into account the current uncertainties in spectroscopic abundances and in the metallicity scale. The metal-rich peak of our distribution is at the edge of the metallicity range covered by our MIC relations.
It is worth noting that our photometric metallicity distribution for the RGs in Baade’s Window also agrees fairly well with the spectroscopic MDF obtained by the ARGOS survey for RGs in the Galactic bulge at latitude b = −5° (Ness et al. 2013a, see panel a of their Fig. 11), with the spectroscopic MDF derived by Bensby et al. (2013) for a sample of 58 micro-lensed bulge dwarfs, and with the MDF obtained by Uttenthaler et al. (2012) for a sample of ~400 RGs in the a region of the bulge centered on (l,b) = (0°, −10°).
Our findings indicate that Strömgren-NIR photometry can provide solid constraints on the metallicity distribution not only for cluster RGs but also of field and halo bulge RGs. The key advantage of the current approach is that it can be applied to a large sample of field RGs located along different lines of sight. The main drawback is that it requires accurate and deep photometry in at least three Strömgren bands (v,b,y) and at least one NIR band. However, accurate NIR photometry is now available for a significant fraction of the Galactic bulge (VISTA, Saito et al. 2012). An extensive use of the current approach is hampered because current wide-field imagers at 4–8 m class telescopes are not equipped with high-quality Strömgren filters. It goes without saying that a medium to large Strömgren survey of the low reddening regions of the Galactic bulge can have a substantial impact on our understanding of the bulge stellar populations. This means more quantitative constraints on the formation and evolution of the bulge and its chemical enrichment.
Online material
Log of the Strömgren images collected with EFOSC2 on the NTT for the bulge cluster NGC 6528 and the halo cluster NGC 6752 adopted in this investigation (program ID: 085.D-0374, PI: A. Calamida).
The separation index quantifies the degree of crowding of a star after PSF photometry has been performed (Stetson et al. 2003).
The complete set of BCs, CTRs, and the Vega flux are available at http://wwwuser.oat.ts.astro.it/castelli
Data were retrieved from the VO database using Topcat.
Acknowledgments
We thank Adriano Pietrinferni for his help with ZAHB models, and Elizabeth Fraser for helping us in the editing of the manuscript. We acknowledge the referee for his/her pertinent comments and suggestions that helped us to improve the content and the readability of the manuscript. Support for this work has been provided by the IAC (grant 310394), and the Education and Science Ministry of Spain (grants AYA2007-3E3506, and AYA2010-16717). This work was partly supported by PRIN INAF 2011 “Tracing the formation and evolution of the Galactic halo with VST” (PI: M. Marconi) and by PRIN-MIUR (2010LY5N2T) “Chemical and dynamical evolution of the Milky Way and Local Group galaxies” (PI: F. Matteucci). F.M. is thankful for the financial support from FONDECYT for project 3140177 and from the Chilean BASAL Centro de Excelencia en Astrofísica y Tecnologías Afines (CATA) grant PFB-06/2007. APM acknowledges the financial support from the Australian Research Council through Discovery Project grant DP120100475.
References
- Anthony-Twarog, B. J., & Twarog, B. A. 1994, AJ, 107, 1577 (ATT94) [NASA ADS] [CrossRef] [Google Scholar]
- Anthony-Twarog, B. J., & Twarog, B. A. 1998, AJ, 116, 1922 (ATT98) [NASA ADS] [CrossRef] [Google Scholar]
- Babusiaux, C., Gòmez, A., Hill, V., et al. 2010, A&A, 519, A77 [NASA ADS] [CrossRef] [EDP Sciences] [Google Scholar]
- Bellman, S., Briley, M. M., Smith, G. H., & Claver, C. F. 2001, PASP, 113, 326 [NASA ADS] [CrossRef] [Google Scholar]
- Bensby, T., Adén, D., Meléndez, J., et al. 2011, A&A, 533, A134 [NASA ADS] [CrossRef] [EDP Sciences] [Google Scholar]
- Bensby, T., Yee, J. C., Feltzing, S., et al. 2013, A&A, 549, A147 [NASA ADS] [CrossRef] [EDP Sciences] [Google Scholar]
- Bertelli, G., Bressan, A., Chiosi, C., Fagotto, F., & Nasi, E. 1994, A&AS, 106, 275 [NASA ADS] [Google Scholar]
- Bond, H. E. 1970, ApJS, 22, 117 [NASA ADS] [CrossRef] [Google Scholar]
- Bono, G., Stetson, P. B., VandenBerg, D. A., et al. 2010, ApJ, 708, L74 [CrossRef] [Google Scholar]
- Brasseur, C. M., Stetson, P. B., VandenBerg, D. A., et al. 2010, AJ, 140, 1672 [NASA ADS] [CrossRef] [Google Scholar]
- Calamida, A., Stetson, P. B., Bono, G., et al. 2005, ApJ, 634, L69 [NASA ADS] [CrossRef] [Google Scholar]
- Calamida, A., Bono, G., Stetson, P. B., et al. 2007, ApJ, 670, 400 (CA07) [NASA ADS] [CrossRef] [Google Scholar]
- Calamida, A., Bono, G., Stetson, P. B., et al. 2009, ApJ, 706, 1277 [NASA ADS] [CrossRef] [Google Scholar]
- Calamida, A., Bono, G., Corsi, C. E., et al. 2011, ApJ, 742, L28 [NASA ADS] [CrossRef] [Google Scholar]
- Calamida, A., Monelli, M., Milone, A. P., et al. 2012, A&A, 544, A152 [NASA ADS] [CrossRef] [EDP Sciences] [Google Scholar]
- Cardelli, J. A., Clayton, G. C., & Mathis, J. S. 1989, ApJ, 345, 245 [NASA ADS] [CrossRef] [Google Scholar]
- Carpenter, J. M. 2001, AJ, 121, 2851 [NASA ADS] [CrossRef] [Google Scholar]
- Carretta, E., Cohen, J. G., Gratton, R., & Bradford, B. B. 2001, AJ, 122, 1469 [NASA ADS] [CrossRef] [Google Scholar]
- Carretta, E., Gratton, R., Bragaglia, A., Bonifacio, P., & Pasquini, L. 2004, A&A, 416, 925 [NASA ADS] [CrossRef] [EDP Sciences] [Google Scholar]
- Carretta, E., Bragaglia, A., Gratton, R., D’Orazi, V., & Lucatello, S. 2009, A&A, 508, 695 [NASA ADS] [CrossRef] [EDP Sciences] [Google Scholar]
- Castelli, F., & Kurucz, R. L. 1994, A&A, 281, 817 [NASA ADS] [Google Scholar]
- Castelli, F., & Kurucz, R. L. 2006, A&A, 454, 333 [NASA ADS] [CrossRef] [EDP Sciences] [Google Scholar]
- Catelan, M., Minniti, D., Lucas, P. W., et al. 2011, in RR Lyrae Stars, Metal-Poor Stars, and the Galaxy, ed. A. McWilliam, 145 [Google Scholar]
- Chené, A. N., Borissova, J., Clarke, J. R. A., et al. 2012, A&A, 545, A54 [NASA ADS] [CrossRef] [EDP Sciences] [Google Scholar]
- Coppola, G., Stetson, P. B., Marconi, M., et al. 2013, ApJ, 775, 6 [NASA ADS] [CrossRef] [Google Scholar]
- Crawford, D. L. 1975, AJ, 80, 955 [NASA ADS] [CrossRef] [Google Scholar]
- Cutri, R. M., Skrutskie, M. F., van Dyk, S., et al. 2003, The IRSA 2MASS All-Sky Point Source Catalog, NASA/IPAC Infrared Science Archive, http://irsa.ipac.caltech.edu/applications/Gator/ [Google Scholar]
- Dékány, I., Minniti, D., Catelan, M., et al. 2013, ApJ, 776, 19 [Google Scholar]
- Dell’Omodarme, M., Valle, G., Degl’Innocenti, S., & Prada Moroni, P. G. 2012, A&A, 540, A26 [NASA ADS] [CrossRef] [EDP Sciences] [Google Scholar]
- Di Cecco, A., Becucci, R., Bono, G., et al. 2010, PASP, 122, 991 [NASA ADS] [CrossRef] [Google Scholar]
- Emerson, J., & Sutherland, W. 2010, The Messenger, 139, 2 [NASA ADS] [Google Scholar]
- Faria, D., Feltzing, S., Lundstrom, I., et al. 2007, A&A, 465, 357 [NASA ADS] [CrossRef] [EDP Sciences] [MathSciNet] [Google Scholar]
- Feltzing, S., & Johnson, R. A. 2002, A&A, 385, 67 [NASA ADS] [CrossRef] [EDP Sciences] [Google Scholar]
- Ferraro, F. R., Montegriffo, P., Origlia, L., & Fusi Pecci, F. 2000, AJ, 119, 128 [Google Scholar]
- Fiorentino, G., Stetson, P. B., Monelli, M., et al. 2012, ApJ, 759, L12 [Google Scholar]
- Francois, P. 1986, A&A, 160, 264 [NASA ADS] [Google Scholar]
- Freeman, K., Ness, M., Wylie-de-Boer, E., et al. 2013, MNRAS, 428, 3660 [NASA ADS] [CrossRef] [Google Scholar]
- Fulbright, J. P. 2000, AJ, 120, 184 [Google Scholar]
- Fulbright, J. P., McWilliam, A., & Rich, R. M. 2007, ApJ, 636, 821 [Google Scholar]
- Gonzalez, O. A., Rejkuba, M., Zoccali, M., et al. 2011, A&A, 530, A54 [NASA ADS] [CrossRef] [EDP Sciences] [Google Scholar]
- Gratton, R., Sneden, C., & Carretta, E. 2004, ARA&A, 42, 385 [NASA ADS] [CrossRef] [Google Scholar]
- Grundahl, F., VandenBerg, D. A., Bell, R. A., Andersen, M. I., & Stetson, P. B. 2000, AJ, 120, 1884 [NASA ADS] [CrossRef] [Google Scholar]
- Grundahl, F., Stetson, P. B., & Andersen, M. I. 2002, A&A, 395, 481 [NASA ADS] [CrossRef] [EDP Sciences] [Google Scholar]
- Heasley, J. N., Janes, K. A., Zinn, R., et al. 2000, AJ, 120, 879 [NASA ADS] [CrossRef] [Google Scholar]
- Hill, V., Lecureur, A., Gómez, A., & Zoccali, M. 2011, A&A, 534, A80 [NASA ADS] [CrossRef] [EDP Sciences] [Google Scholar]
- Irwin, M. J., Lewis, J., Hodgkin, S., et al. 2004, in SPIE Conf. Ser., 5493, eds. P. J. Quinn, & A. Bridger, 422 [Google Scholar]
- Johnson, C. I., Rich, R. M., Kobayashi, C., et al. 2013, ApJ, 765, 157 [NASA ADS] [CrossRef] [Google Scholar]
- Kraft, R. P. 1994, PASP, 106, 553 [NASA ADS] [CrossRef] [Google Scholar]
- Kraft, R. P., & Ivans, I. I. 2003, PASP, 115, 143 [NASA ADS] [CrossRef] [Google Scholar]
- Lagioia, E. P., Milone, A. P., Stetson, P. B., et al. 2014, ApJ, 782, 50 (LA14) [NASA ADS] [CrossRef] [Google Scholar]
- Langer, G. E., Kraft, R. P., Carbon, D. F., Friel, E., & Oke, J. B. 1986, PASP, 98, 473 [Google Scholar]
- Mauro, F., Moni Bidin, C., Chené, A.-N., et al. 2013, Rev. Mex. Astron. Astrofis., 49, 189 [NASA ADS] [Google Scholar]
- Mauro, F., Moni Bidin, C., Geisler, D., et al. 2014, A&A, 563, A76 [NASA ADS] [CrossRef] [EDP Sciences] [Google Scholar]
- McWilliam, A., & Rich, R. M. 1994, ApJS, 91, 749 [NASA ADS] [CrossRef] [Google Scholar]
- Milone, A. P., Bedin, L. R., Piotto, G., et al. 2008, ApJ, 673, 241 [NASA ADS] [CrossRef] [Google Scholar]
- Milone, A. P., Piotto, G., Bedin, L. R., et al. 2012, ApJ, 744, 58 [NASA ADS] [CrossRef] [Google Scholar]
- Minniti, D., Lucas, P. W., Emerson, J. P., et al. 2010, New Astron., 15, 433 [NASA ADS] [CrossRef] [Google Scholar]
- Momany, Y., Ortolani, S., Held, E. V., et al. 2003, A&A, 402, 607 [NASA ADS] [CrossRef] [EDP Sciences] [Google Scholar]
- Moni Bidin, C., Mauro, F., Geisler, D., et al. 2011, A&A, 535, A33 [NASA ADS] [CrossRef] [EDP Sciences] [Google Scholar]
- Ness, M., Freeman, K., Athanassoula, E., et al. 2013, MNRAS, 430, 836 [NASA ADS] [CrossRef] [Google Scholar]
- Nissen, P. E. 1981, A&A, 97, 145 [NASA ADS] [Google Scholar]
- Origlia, L., Valenti, E., & Rich, R. M. 2005, MNRAS, 356, 1276 [NASA ADS] [CrossRef] [Google Scholar]
- Pietrinferni, A., Cassisi, S., Salaris, M., & Castelli, F. 2004, ApJ, 612, 168 [NASA ADS] [CrossRef] [Google Scholar]
- Pietrinferni, A., Cassisi, S., Salaris, M., & Castelli, F. 2006, ApJ, 642, 697 (PI06) [Google Scholar]
- Pilachowski, C. A., Bothun, G. D., Olszewski, E. W., & Odell, A. 1983, ApJ, 273, 187 [NASA ADS] [CrossRef] [Google Scholar]
- Rich, R. M., Origlia, L., & Valenti, E. 2012, ApJ, 746, 59 [NASA ADS] [CrossRef] [Google Scholar]
- Saito, R. K., Zoccali, M., McWilliam, A. M., et al. 2011, AJ, 142, 76 [NASA ADS] [CrossRef] [Google Scholar]
- Saito, R., Hempel, M., Minniti, D., et al. 2012, A&A, 537, A107 [NASA ADS] [CrossRef] [EDP Sciences] [Google Scholar]
- Salaris, M., Chieffi, A., & Straniero, O. 1993, ApJ, 414, 580 [NASA ADS] [CrossRef] [Google Scholar]
- Salasnich, B., Girardi, L., Weiss, A., & Chiosi, C. 2000, A&A, 361, 1023 [NASA ADS] [Google Scholar]
- Saviane, I., Da Costa, G. S., Held, E. V., et al. 2012, A&A, 540, A27 (SA12) [NASA ADS] [CrossRef] [EDP Sciences] [Google Scholar]
- Skrutskie, M. F., Cutri, R. M., Stiening, R., et al. 2006, AJ, 131, 1163 [NASA ADS] [CrossRef] [Google Scholar]
- Sneden, C., Kraft, R. P., Prosser, C. F., & Langer, G. E. 1991, AJ, 102, 2001 [NASA ADS] [CrossRef] [Google Scholar]
- Stetson, P. B. 1987, PASP, 99, 191 [NASA ADS] [CrossRef] [Google Scholar]
- Stetson, P. B. 1990, PASP, 102, 932 [NASA ADS] [CrossRef] [Google Scholar]
- Stetson, P. B. 1991, AJ, 102, 589 [NASA ADS] [CrossRef] [Google Scholar]
- Stetson, P. B. 1993, IAU Colloq. 136, Stellar Photometry - Current Techniques and Future Developments (Cambridge: Cambridge University Press), 291 [Google Scholar]
- Stetson, P. B. 1994, PASP, 106, 250 [NASA ADS] [CrossRef] [Google Scholar]
- Stetson, P. B., Bruntt, H., & Grundahl, F. 2003, PASP, 115, 413 [NASA ADS] [CrossRef] [Google Scholar]
- Strömgren, B. 1964, ApNr, 9, 333 [Google Scholar]
- Thèvenin, F., & Idiart, T. P. 1999, ApJ, 521, 753 [NASA ADS] [CrossRef] [Google Scholar]
- Uttenthaler, S., Schultheis, M., Nataf, D. M., et al. 2012, A&A, 546, A57 [NASA ADS] [CrossRef] [EDP Sciences] [Google Scholar]
- Valenti, E., Ferraro, F. R., & Origlia, L. 2004, MNRAS, 351, 1204 [NASA ADS] [CrossRef] [Google Scholar]
- Valenti, E., Origlia, L., & Rich, R. M. 2011, MNRAS, 414, 2690 [NASA ADS] [CrossRef] [Google Scholar]
- van Loon, J. Th., Gilmore, G. F., Omont, A., et al. 2003, MNRAS, 338, 857 [Google Scholar]
- Vásquez, S., Zoccali, M., Hill, V., et al. 2013, A&A, 555, A91 [NASA ADS] [CrossRef] [EDP Sciences] [Google Scholar]
- Zinn, R., & West, M. J. 1984, ApJS, 55, 45 [NASA ADS] [CrossRef] [Google Scholar]
- Zoccali, M., Barbuy, B., Hill, V., et al. 2003, A&A, 399, 931 [NASA ADS] [CrossRef] [EDP Sciences] [Google Scholar]
- Zoccali, M., Renzini, A., Ortolani, S., et al. 2004, A&A, 423, 507 (ZO04) [NASA ADS] [CrossRef] [EDP Sciences] [Google Scholar]
- Zoccali, M., Lecureur, A., Barbuy, B., et al. 2006, A&A, 457, L1 [NASA ADS] [CrossRef] [EDP Sciences] [Google Scholar]
- Zoccali, M., Hill, V., Lecureur, A., et al. 2008, A&A, 486, 177 (ZO08) [NASA ADS] [CrossRef] [EDP Sciences] [Google Scholar]
All Tables
Photometric and spectroscopic metallicities for four RG stars in the bulge cluster NGC 6528.
Log of the Strömgren images collected with EFOSC2 on the NTT for the bulge cluster NGC 6528 and the halo cluster NGC 6752 adopted in this investigation (program ID: 085.D-0374, PI: A. Calamida).
All Figures
|
Fig. 1 Footprints of the different optical-NIR data sets for the bulge cluster NGC 6528 and its surrounding field. |
| In the text | |
|
Fig. 2 y,y − J (top), b,b − J (middle), v,v − J (bottom) CMDs of NGC 6528. Stars were selected according to proper motions and photometric accuracy and were corrected for differential reddening. The red solid and green dashed lines display cluster isochrones at fixed age but different chemical compositions. The blue dotted and purple dotted-dashed lines display younger isochrones for the same chemical compositions (see labeled values). The cluster isochrones are based on evolutionary models computed by assuming either a scaled solar (s-s, red solid and blue dotted) or an α-enhanced (α-e) chemical mixture (green dashed and purple dotted-dashed). Orange and cyan filled dots mark RGs with spectroscopic abundances from ZO04 and SA12, respectively. The two horizontal arrows mark the location of the RHB (brighter) and of the RGB bump (fainter), while the right bent arrow shows the reddening vector. The adopted true distance modulus, mean reddening and error bars are labeled. |
| In the text | |
|
Fig. 3 K,J − K CMD of NGC 6528. Stars were selected according to proper motions and photometric accuracy and corrected for differential reddening. Symbols and lines are the same as in Fig. 2. |
| In the text | |
|
Fig. 4 Same as Fig. 2, but for the field surrounding NGC 6528. Stars were selected according to proper motions and photometric accuracy and corrected for differential reddening. Symbols and lines are the same as in Fig. 2. |
| In the text | |
|
Fig. 5 Same as Fig. 3, but for the field surrounding NGC 6528. Stars were selected according to photometric accuracy only. Symbols and lines are the same as in Fig. 2. |
| In the text | |
|
Fig. 6 3D K,J − K CMD of field stars surrounding NGC 6528, based on VIRCAM-SOFI photometry. The CMD is slightly rotated to better show the separation between blue MS and RG stars. At K = 14, MS stars cluster around J − K = 0.6, while RGs around J − K = 0.8 mag. |
| In the text | |
|
Fig. 7 Top: 2D K-band – based on VIRCAM-SOFI photometry – luminosity function of field RGs surrounding NGC 6528. Middle: projected K-band luminosity function of field RGs. The two Gaussian functions adopted to fit the RC-RHB regions are overplotted as red solid lines. The green line shows the cumulative fit. Bottom: projected K-band luminosity function of NGC 6528 RGs selected according to proper motions. Symbols and lines are the same as in the middle panel. |
| In the text | |
|
Fig. 8 Left panels: m1 vs. y − K plane (panel a)) for isochrones at fixed cluster age (t = 12 Gyr) and different global metallicities ([M/H], see labeled values). The evolutionary phases range from ≈the base (empty squares) to ≈the tip of the RGB (asterisks). Evolutionary tracks were computed by assuming a scaled solar chemical mixture and transformed into the observational plane by adopting atmosphere models computed assuming the same mixture. Panels b) and c) show similar relations, but in the m1 vs. y − H and in the m1 vs. y − J plane. Right panels: same as the left, but for the m1 vs. u − y (panel d)), m1 vs. v − y (panel e)), m1 vs. b − y (panel f)) planes. |
| In the text | |
|
Fig. 9 a) Selected field RGs from the sample of ATT94/ATT98 plotted in the [m], y − J plane (Ns = 61, filled dots). b) Difference between photometric and spectroscopic metallicities, Δ [M/H] = [M/H] phot − [M/H] spec, plotted versus [M/H] spec for the 61 field RGs (filled dots). Photometric metallicities are based on the α-enhanced [m] , y − J MIC relation. c) Normalized photometric metallicity distribution for the 61 RGs obtained with the [m], y − J MIC relation (black solid line), compared with the normalized spectroscopic distribution (black dashed). |
| In the text | |
|
Fig. 10 Top: selected RG stars of the GGC M 92 plotted in the [m], y–K plane. Bottom: photometric metallicity distribution obtained by applying the [m], y − K MIC relation for the sample 83 RG stars. |
| In the text | |
|
Fig. 11 Top: selected RGs of the bulge cluster NGC 6624 plotted in the [m], y − K plane. Bottom: photometric metallicity distribution obtained by applying the [m], y − K MIC relation for the sample of 95 RGs. |
| In the text | |
|
Fig. 12 Top: selected RGs of the bulge cluster NGC 6528 plotted in the [m], y − J plane. Bottom: photometric metallicity distribution obtained by applying the [m], y − J MIC relation for the sample of 40 RGs. Stars with spectroscopic measurements by ZO08 and SA12 are marked with filled red stars and open blue diamonds, respectively. |
| In the text | |
|
Fig. 13 Top: selected RGs of the field surrounding NGC 6528 in Baade’s Window plotted in the [m ] , y − J plane. Bottom: photometric metallicity distribution obtained by applying the [m] , y − J MIC relation to the sample of 56 Baade’s Window RGs. |
| In the text | |
Current usage metrics show cumulative count of Article Views (full-text article views including HTML views, PDF and ePub downloads, according to the available data) and Abstracts Views on Vision4Press platform.
Data correspond to usage on the plateform after 2015. The current usage metrics is available 48-96 hours after online publication and is updated daily on week days.
Initial download of the metrics may take a while.