Fig. 12
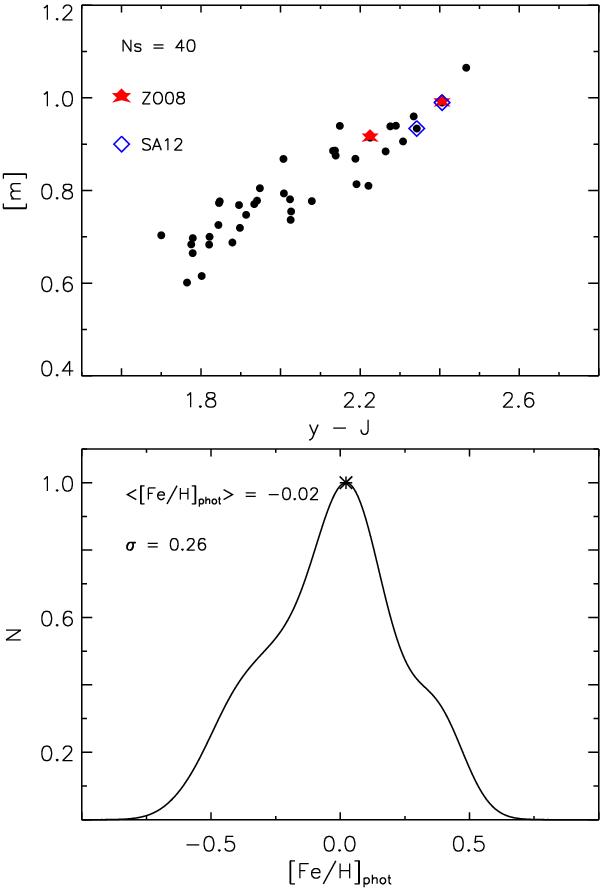
Top: selected RGs of the bulge cluster NGC 6528 plotted in the [m], y − J plane. Bottom: photometric metallicity distribution obtained by applying the [m], y − J MIC relation for the sample of 40 RGs. Stars with spectroscopic measurements by ZO08 and SA12 are marked with filled red stars and open blue diamonds, respectively.
Current usage metrics show cumulative count of Article Views (full-text article views including HTML views, PDF and ePub downloads, according to the available data) and Abstracts Views on Vision4Press platform.
Data correspond to usage on the plateform after 2015. The current usage metrics is available 48-96 hours after online publication and is updated daily on week days.
Initial download of the metrics may take a while.