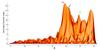
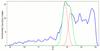
Fig. 7
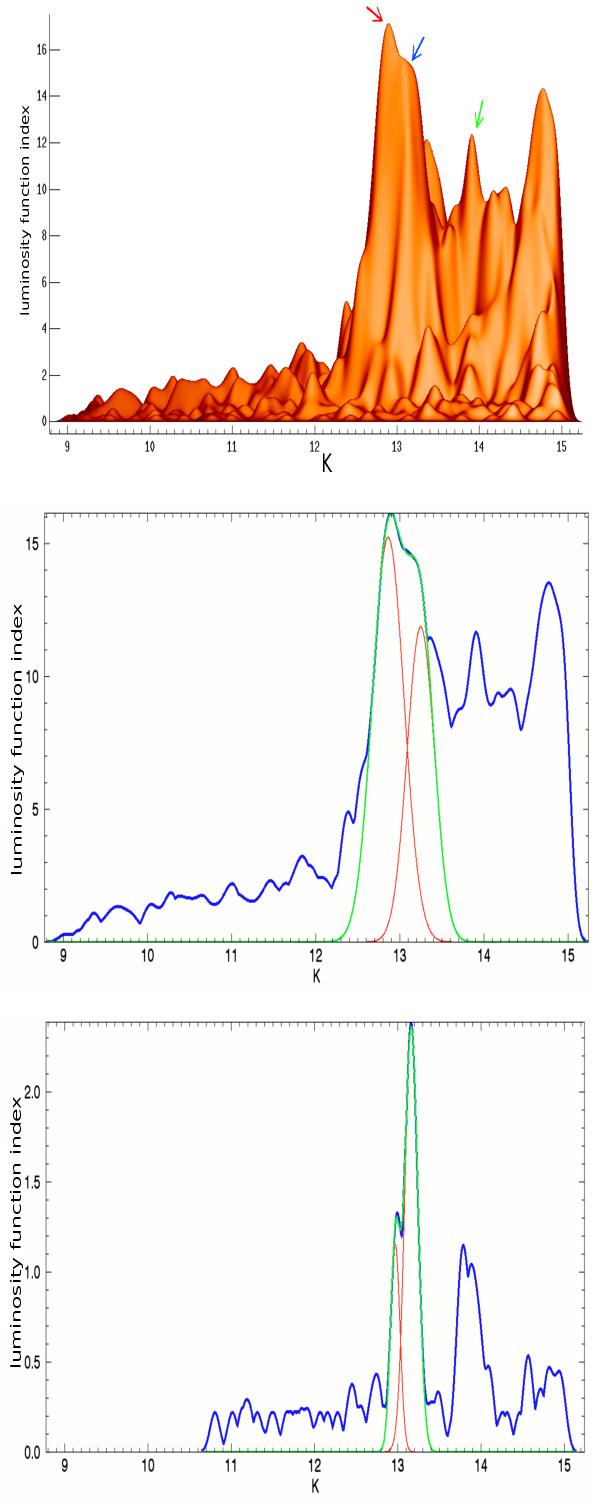
Top: 2D K-band – based on VIRCAM-SOFI photometry – luminosity function of field RGs surrounding NGC 6528. Middle: projected K-band luminosity function of field RGs. The two Gaussian functions adopted to fit the RC-RHB regions are overplotted as red solid lines. The green line shows the cumulative fit. Bottom: projected K-band luminosity function of NGC 6528 RGs selected according to proper motions. Symbols and lines are the same as in the middle panel.
Current usage metrics show cumulative count of Article Views (full-text article views including HTML views, PDF and ePub downloads, according to the available data) and Abstracts Views on Vision4Press platform.
Data correspond to usage on the plateform after 2015. The current usage metrics is available 48-96 hours after online publication and is updated daily on week days.
Initial download of the metrics may take a while.